On the Conservation-within-Capitalism Scenario [Version 2.0]
Table of Contents
Inaccessibility of Outer Space
Impossibility of Sustainable Growth in a Finite World
An Alternative to Flat-Earth Economics
The Conservation-within-Capitalism Scenario
The Apollo Alliance Ten-Point Plan
Commentary on the Apollo Alliance Ten-Point Plan
Commentary Continued: The Nuclear Option
Energy Returned over Energy Invested (ER/EI)
Arithmetical and Logical Absurdities in THE APOLLO JOBS REPORT
Computations for the Conservation-within-Capitalism Scenario
Diagram of the Log of GDP, GDC, Trade Deficit, and Exports from 2005 to 2050
The Principal Period during which the Apollo Alliance Plan Is Assumed To Be Active, 2005-2015
The Three-Year Period during which the Remaining Imports Are To Be Repatriated, 2015-2018
The Rest of the Twenty-First Century
Further Explanation of Calculations
The Ten-Point Plan Results in a Nuclear Society
The No-Growth and No-Sales Scenario
Dematerialism: Unwinding Materialism
Abstract
The Apollo Alliance Ten-Point Plan (http://www.apolloalliance.org/) is a good example of conservation within capitalism. Inasmuch as the lavish expenditure of energy is the prima facie cause of the national and world crisis associated with Peak Oil, it is difficult to see how conservation could possibly be a bad idea. Capitalism, however, demands economic growth, which cannot be sustained indefinitely in a finite world. Therefore, instead of preventing Die Off in the wake of Peak Oil, robust conservation measures might permit population to overshoot the carrying capacity of the Earth to a greater extent than in the no-conservation case thus exacerbating the ultimate Die-Off that has been thereby postponed. The Apollo Alliance policies are supposed to provide simultaneously energy independence for the United States and robust economic growth into the foreseeable future. These goals are based upon flat-earth economics, which maintains that growth of both population and prosperity can be sustained indefinitely on a round ball whose diameter does not exceed 8000 miles.
In this paper, spreadsheet calculations have been carried out for five increasingly progressive scenarios for the remainder of the Twenty-First Century: (1) moderate economic growth, (2) minimal economic growth, (3) stagnation, (4) moderate shrinkage, and (5) a leisure economy. After looking briefly at flat-earth economics and the alternative suggested by Howard T. Odum, the Ten-Point Plan is discussed, particularly the notion of a Hydrogen Economy, which, if it means anything, means nuclear.
After the assumptions upon which this paper is based have been established, the paper discusses the first of the five scenarios, namely, the Conservation-within-Capitalism Scenario itself, referred to here as the Reference Case. The diagram employed by the author to derive the necessary equations is described, followed by a detailed explanation of the spreadsheet CwC-ReferenceCase.xls. Since all five scenarios are identical for the first thirteen years of the ‘Apollo Project’ during which trade and energy imports are repatriated to establish independence and to stimulate the economy, it is necessary to describe in detail only the first spreadsheet, which was set up so that the four additional spreadsheets could be produced quickly with only minor changes in the Reference Case. The computations are decidedly simple from the viewpoint of mathematics. They employ little more than arithmetic and high-school algebra. The quantitative results depend primarily upon the assumptions concerning standards of living. It is precisely the American standard of living that is in question.
Conclusions for the Reference Case are given first. The Reference Case for the Conservation-within-Capitalism Scenario assumes a steady increase in the standard of living ratio (energy per capita ratio corrected for conservation) of 3.09% throughout the Twenty-First Century. This increase in standard of living is due primarily to activities advocated by the Apollo Alliance, although the Apollo Alliance does not mention nuclear power except obliquely by employing the code word Hydrogen Economy. The results for the Reference Case are followed by results for the One-Percent Growth Scenario, the No-Growth Scenario, the No-Growth and No-Sales Scenario, and, finally, the case of the Natural Economy advocated by this author in On the Preservation of Species (POS) and in numerous essays hyperlinked on the website to which POS is linked written over the last ten or fifteen years. The principal data for the year 2100 and the URLs for the full spreadsheets for all five scenarios are given in Table 4.
Introduction
Flat-Earth Economics
Finiteness of Earth
If The Earth were a flat plane extending to infinity in all directions, market forces would induce geologists to find sufficient fossil-fuel deposits to meet growing demand for primary energy simply by extending the frontiers of petroleum exploration. If the United States were a nation state the territory of which could be expanded indefinitely so as to capture infinite sunlight or wind or to discover arbitrarily many growing plants, renewable energy, too, could be harvested to any extent necessary to the economy. Presumably, part of the basement of the flat earth would be flooded with an extremely hot magma from which infinite energy might be withdrawn without more than infinitesimal cooling whereas the rest would be riddled with pockets of crude oil and natural gas that might be found by drilling deeper and deeper. Moreover, migrating animals driven from their original habitats by the expansion of the human population and its growing economy would find even better habitats safe from human incursion for as long as necessary. Regrettably, a nation with a finite territory in a finite world is the stage on which the Conservation-within-Capitalism Scenario is to be enacted.
Inaccessibility of Outer Space
Some people might object that, while sustainable growth is impossible on Earth, we should in no wise limit our thinking to this tiny orb. This is a fair objection that deserves a serious answer. Within our lifetimes, travel to distant worlds has become almost routine – in fiction if not in reality. I wish to point out the principal objections to this idea at this time and refer disbelievers elsewhere:
1. Ultimately, colonization involves conquest and depredation, which was never right but perhaps excusable at the time of Magellan as no serious philosopher had addressed the issue previous to Magellan’s time as far as I know and, even more likely, as far as Magellan knew. Nowadays, it would be very difficult to find someone who would not acknowledge that most serious philosophers reject conquest and depredation as acceptable behavior. Even the predatory Neo-Cons cloak their rhetoric in Liberal, i.e., politically-correct, clothing.
2. The limitation of travel speed by the speed of light makes travel to extra-solar planets capable of supporting life inconsistent with the longest lifespan of a human being that can reasonable be expected to be achieved within the Twenty-First Century – dreams of suspended animation notwithstanding. Suppose, on the other hand, that, despite the improbability of doing so, a spaceship could be built sufficiently complete that the children, the children’s children, and so on for many generations might enjoy a reasonably bearable life living on that spaceship perhaps under conditions no worse than conditions on Spaceship Earth; and, suppose, in addition, that such a nation of space travelers could retain as part of their cultural heritage the understanding of their mission as space travelers to continue human existence upon a habitable planet at a distance of many light years from Earth. Supposing all that, the generation that was faced with imminent arrival at the destination would necessarily regard the arrival as essentially the end of the only world they had ever known. Although, in this thought experiment, we know that life might go on, they might anticipate it with the same dread as we should experience facing the end of life on Earth.
3. To make life on the spaceship so comfortable that the impending arrival at the distant habitable planet will seem like the end of the world would require a truly large spaceship - perhaps the size of a small moon. To build it would require harvesting the very last of the useful resources of Earth. The expected energy returned on energy invested is poor.
Additional objections, in particular moral objections, can be found in my paper On Space Travel and Research.
Impossibility of Sustainable Growth in a Finite World
Clearly, a positive rate of growth (in energy consumption per capita and population) sufficiently close to zero can be sustained until any given future time. That is, if you give me a time in the future (a million years, say), I can find a positive rate of growth sufficiently small that it can be sustained until that time other factors not intervening (ten to the minus 23rd power fractional increase per year, say). On the other hand, no matter how short a period of time is given, a rate of growth can be found that will make further growth infeasible – whether or not such a rate of growth is attainable. These are simple facts of arithmetic and are not open to political debate.
The arithmetical exercises that form the centerpiece of this paper may convince a few people who are not susceptible to the illogic of sustainable growth in a finite world. Many people will find such exercises completely unnecessary as they know that any rate of growth whatever in either population or standard of living (or both) that redounds to an increase in the rate at which energy is degraded is unsustainable. This can be proved on purely logical grounds without a single computation. Nevertheless, it is probably worth taking the trouble to provide actual numbers corresponding to various rates of growth. In these exercises, I have satisfied energy deficits with nuclear energy because nuclear power installations (NPIs) exhaust our share of the surface area of Earth to the least extent of any technology that can be assumed to be sustainable provided only that fissionable materials can be created at least as fast as they are degraded. Since a fast breeder reactor has been made to operate intermittently for short periods of time in France, for example, it is reasonable to suppose that technological progress over the better part of a century could make fast breeder reactors stable and reliable. What cannot be created is additional surface area of Earth on which to place them. In addition, nuclear plants require copious water supplies; and, if thermal splitting is accomplished to provide hydrogen for fuel (directly or to treat other substances to make other fuels), the fresh water that will be converted to atmospheric water must be replaced, presumably by transporting and desalinating ocean water, which might lead to ratios of Energy Returned over Energy Invested (ERoEIs) less than one. Also, since we are very close to or even past Peak Water, a water balance might show that nuclear plants run out of water even before they run out of land, however this analysis and thermal splitting of seawater will be deferred to another paper.
An Alternative to Flat-Earth Economics
Odum’s Theory of Emergy
The emergy theory of Howard T. Odum (http://dieoff.org/page170.htm) is perhaps the swiftest route to a reasonable alternative to flat-earth economics. Money is the central object in flat-earth economics, however, money is a poor measure of value:
1. Money does not satisfy readily tractable balance equations. The methods by which it is created are not widely published generally and may occur secretly from time to time.
2. Different quantities of money are associated with identical economic transactions at the same time due to inequities in the market and at different times due to monetary inflation.
3. Prof. Howard T. Odum has given a number of additional reasons why money is a poor measure of wealth that are included here in Odum’s own words for completeness:
Real wealth is food, fuel, water, wood for houses, fiber for clothes, raw minerals, electricity, information.
· A country is wealthy that has more of this real stuff used per person.
· Money is only paid to people and is not proportional to real wealth.
· Prices and costs are inverse to real wealth.
· When resources are abundant, standard of living is high, but prices low.
· When resources are scarce, prices are high, more money goes to bring resources, a few people get rich, but the net contribution to prosperity is small.
· Real wealth is mostly the work of nature and has to be evaluated with a scientific ... measure, emergy.
Odum’s theory, as modified by Wayburn in Emergy and Economics, Chapter 2 of On the Preservation of Species, is based upon energy corrected for entropy, which satisfies the availability balance equation, obtained by combining the First and Second Laws of Thermodynamics. [The entropy balance is closed with a lost work term. It (the entropy balance) is multiplied by the temperature of the coldest heat sink to which we can dump exhaust energy (in keeping with the Second Law) and subtracted from the energy balance.] The value of every economic object is measured by its emergy, with an m, whose units are the same as energy – except that, in this essay, in keeping with the practice of Odum, the unit is prefaced with the letters em, e.g., emquad instead of quad or emjoule instead of joule.
The embodied energy or emergy of a primary fuel is the Gibbs availability of the fuel in quads multiplied by the transformity defined below. The emergy of manufactured objects is the sum total of all of the emergy that went into their production whether it be primary emergy, the emergy of other manufactured items, or some pro-rata share of the living expenses of the people involved in the manufacturing process directly and indirectly. That is, some portion of the emergy consumed by the man (or woman) who irons the shirt of the man who serves the lunch of the man who does the income tax of the man who drives the bus that takes the man who services the copy machine of the man who does the payroll for the personnel department of the company where the man works who assembles the widget must be charged to the emergy of the widget. (One rarely sees the costs of hiring and firing personnel, or, for that matter, the energetic costs of promoting solar energy, say, discussed in so-called Energy Returned on/over Energy Invested (ERoEI) calculations.)
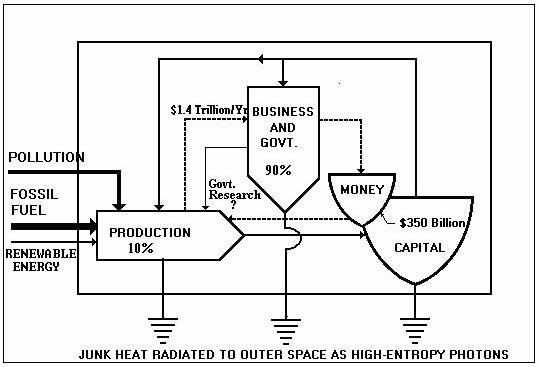
Figure 1. Odum’s emergy diagram for economy
The emergy methodology employed here is discussed in painful detail in Emergy and Economics, Chapter 2 of On the Preservation of Species. The availability balance is derived in Appendix I. In Chapter 2, written over ten years ago, one emergy unit (EU) is taken to be 1 kilowatt-hour of 60 Hz, 110-AC, electricity; however, electricity is not a primary fuel. In this analysis, in order to be congruent with the tabulation of quads in Department of Energy (DOE) tables, one emergy unit, denoted the emquad for the purposes of this study (only), will be taken to be one quadrillion BTUs of reversible work obtained by burning coal. The emergy of one quad of electricity, for example, in emquads is known as its transformity. The transformity of electricity is 2.98 emquads per quad.
Money and Energy
Thus, as we have seen, energy (adjusted for quality and usefulness) is central to the economics employed here. Relying upon money as the basis for economics is an error of catastrophic proportions. Money, however, is extremely useful as a secondary unit of measure provided it can be linked to energy. Throughout the databases of the DOE and other government bureaus one encounters the ratio of total energy budget to gross domestic product (GDP). Figure 1 indicates the countercurrent flow of money with respect to energy in a systems diagram originating with Odum that represents the US or any other economy. (The GDP of 1.4 trillion US dollars per year tells us that this is an old diagram.) The correct units of GDP or Gross National Product (GNP) are dollars per year whereas the correct units for an energy budget are quads per year or, in this paper, emquads per year. Since the years cancel in the ratio of energy budget to GDP, they are usually suppressed; but it is understood that when we refer to dollars (or trillions of dollars) of GDP we mean dollars (or trillions of dollars) per year and when we refer to energy budgets we mean emquads per year. At any particular moment, or, for that matter, over a period of time as short as a year, the ratio of E to GDP is sufficiently constant that we may convert energy figures that apply to an entire economy into monetary flows and conversely. Certainly, this does not apply exactly to each individual economic transaction, but it applies quite accurately to a statistically average economic transaction or to the entire economy. Thus, to compute a reasonable quantitative measure of economic prosperity, we may convert freely between money and energy at any given time.
Disclaimer
These computations are not profound, but they are complex; therefore, mistakes are not only possible – they are likely. I have corrected numerous mistakes over the last two months. I can only hope that such mistakes as are not uncovered by the reviewers will not be fatal to the main thesis. This is not to absolve detractors from their obligation to find putative errors or to accept the results.
Also, there are a few minor inconsistencies that have been allowed to stand intentionally because they do not make a significant difference. For example, all monetary quantities are supposed to be in trillions of chain-linked 1996 US dollars (TUSD). Occasionally, I may have used a monetary datum in dollars chain-linked to some other year. The difference should not be significant. It must be remembered that the large number of decimal places does not indicate high accuracy. Even though a result may have only one significant figure that is at all useful, ten decimal places may have been retained to find mistakes more readily. Many calculations have been done in two ways such that their results should agree to as many decimal places as I wish to show. If they do not, an error is indicated.
As the computation has progressed new subtleties have emerged. If possible, they have been incorporated; however, the author’s time and energy is finite (too), and there comes a time when additional refinements must go by the board and the results presented for better or worse. For example, energy imports, exports, and deficits should be separated from the trade data related to objects that carry embodied energy only, especially since Saudi Arabia has not been considered one of the twenty-five most important trading partners – even. This has not been done as of this writing; so, in particular, in computing the standard of living ratio (energy consumed per capita corrected for conservation) we have counted the energy of imported petroleum twice albeit at a much too low emquad per TUSD ratio as part of the overall trade balance during the first thirteen years. To adjust this inconsistency it has been recommended that we use data from http://www.bea.gov/bea/international/bp_web/simple.cfm?anon=71&table_id=2&area_id=3.
The Conservation-within-Capitalism Scenario
The Apollo Alliance Ten-Point Plan
Many single-issue activists advocate drastic conservation measures whilst retaining a capitalist-style market economy. Of these, a few advocate, in addition, radical measures to reduce population, however the Chinese one-child-per-family initiative has received such bad press that no one dares suggest such a plan for the United States. What is almost never suggested except by a few brave souls and die-hards like myself is the abandonment of economic growth and market economies – especially since the collapse of the Soviet Union. Utopian Schemes [see Bertrand Russell quote on my website] such as communism in any of its manifestations, anarchism, or syndicalism is generally assumed to have been discredited on philosophical, neurological, evolutionary psychological, or utilitarian grounds depending on the propagandist’s specialty. The upshot of over 150 years of anti-communist propaganda, including the Cold War and McCarthy Era in the United States is the oft-repeated assertion, “We have proof that Communism doesn’t work”. Socialist regimes such as Cuba, North Korea, and China are believed quite generally to be totalitarian. This is how the stage is set for the Conservation-within-Capitalism Scenario.
An important example of this scenario is advocated by a group that calls itself the Apollo Alliance in tribute to the famous space initiative of John F. Kennedy who, on May 25, 1961, said “I believe this nation should commit itself to achieving the goal, before this decade is out, of landing a man on the Moon and returning him safely to Earth”. Their statement of purpose, ten primary goals, list of organizers and supporters, etc. can be found at http://www.apolloalliance.org/.
Commentary on the Apollo Alliance Ten-Point Plan
Although much of the mission of the first seven points of the Apollo Alliance Ten-Point Plan (copied verbatim from the AA website) is laudable, there is not a single point that does not represent some misconception as to the nature of the problem. This presents the analyst with a serious difficulty. We are not against conserving energy, nor would we wish to prevent working people from improving their lot; but, since money and energy are inextricably linked, it is impossible to increase the flow of money without increasing the flow of energy even if the activities toward which the flow of money is directed are aimed at reducing the quantity of energy associated with each unit of such activity. If the rate of reduction of the energetic cost of each economic transaction overwhelmed the increase in economic activity, the total energy consumed by the economy would diminish. Unfortunately, conservation is limited by technological developments and the political will of the nation, whereas economic activity is limited only by catastrophe. The drawbacks of points eight, nine, and ten are even more obvious.
Point 1. Promote Advanced Technology and Hybrid Cars: Begin today to provide incentives for converting domestic assembly lines to manufacture highly efficient cars, transitioning the fleet to American made advanced technology vehicles, increasing consumer choice and strengthening the US auto industry.
Comment 1. The automobile culture, more than anything else in American life, is indicative of our inordinate use of energy. The reader may document this for himself. Moreover, the US auto industry has behaved like other profit-oriented entities. It has placed short-term profit over every other interest even its own interests. That which strengthens the auto industry, despite reduction in the energetic cost per unit of transport, will lead to more activity not less. The same can be said for increasing consumer choice. Many people think that economic activity is a good thing. It is the purpose of this study to examine that preference.
Point 2. Invest in More Efficient Factories: Make innovative use of the tax code and economic development systems to promote more efficient and profitable manufacturing while saving energy through environmental retrofits, improved boiler operations, and industrial cogeneration of electricity, retaining jobs by investing in plants and workers.]
Comment 2. Conservation, within capitalism, is impossible without investment of some sort, but financial investment means economic activity, which, in turn, means additional flow of energy. It’s too bad that we cannot have truly conservative investment in social change. Most of the industrial changes suggested by the Apollo Alliance, however, should be applauded so long as social change of the type suggested in “Energy in a Natural Economy” is politically infeasible. Until a more rational method of distributing wealth can be established, we cannot advocate policies that result in loss of jobs.
Point 3. Encourage High Performance Building: Increase investment in construction of “green buildings” and energy efficient homes and offices through innovative financing and incentives, improved building operations, and updated codes and standards, helping working families, businesses, and government realize substantial cost savings.
Comment 3. Commercial building implies economic growth, which is harmful no matter how great the mitigation of that harm by the incorporation of energy efficient technologies. Residential building implies population growth. Indeed, the AA makes no mention of any attempt to reduce population growth. It is true that increased affluence, which clearly is one of the goals of the Ten-Point Program, is likely to be accompanied by a reduction in the Total Fertility Rate. It is also true that increased affluence attracts immigrants and fuels growth. In the United States today, population growth and the spread of urban sprawl, including the sale of agricultural lands to housing developers, is fuelled principally by immigration.
Point 4. Increase Use of Energy Efficient Appliances: Drive a new generation of highly efficient manufactured goods into widespread use, without driving jobs overseas, by linking higher energy standards to consumer and manufacturing incentives that increase demand for new durable goods and increase investment in US factories.
Comment 4. Certainly, a great quantity of energy would be saved if the appliances in our homes and offices, including computers, used less electricity. I, for one, could live without the ability to turn appliances on with a remote control, which necessitates keeping the circuit that receives the signal active while not in use. On the other hand, a policy that purports to “increase demand for new durable goods” cannot be all good. Consumerism has led us to Peak Oil. The fact that, at best, investment cuts both ways has been discussed. To understand how cash flow affects energy consumption, see “Cash Flow in a Mark II Economy”.
Point 5. Modernize Electrical Infrastructure: Deploy the best available technology like scrubbers to existing plants, protecting jobs and the environment; research new technology to capture and sequester carbon and improve transmission for distributed renewable generation.
Comment 5. All of this is good except that it represents economic growth. The AA has said nothing to discourage or disparage economic growth, which no matter how energy efficient, will result eventually in the consumption of even more high-grade energy. The Alliance does not seem to contemplate an end to the increase in the standards of living of workers some of whom will expect prosperity to lead to more prosperity ad infinitum.
Point 6. Expand Renewable Energy Development: Diversify energy sources by promoting existing technologies in solar, biomass and wind while setting ambitious but achievable goals for increasing renewable generation, and promoting state and local policy innovations that link clean energy and jobs.
Comment 6. Good. But, why does the Apollo Alliance emphasize the creation of more jobs as though jobs were not part of the problem? We need people to work less – not more. (See On the Work Ethic.) We need an economic system that uncouples the connection between the distribution of the social dividend, which should be produced by interesting and useful human endeavor performed freely, and the institution of employment, referred to by Marxists, not completely fancifully, as wage slavery. The World is becoming a Work Camp.
Point 7. Improve Transportation Options: Increase mobility, job access, and transportation choice by investing in effective multimodal networks including bicycle, local bus and rail transit, regional high-speed rail and magnetic levitation rail projects.
Comment 7. Whatever can be done should be done to reduce the energy consumed to get people from one place to another – when such journeys are necessary and useful. Certainly, the movements of raw materials, products, and people that benefit society collectively as well as individually should be made on energy-efficient trains rather than in gas-guzzling SUVs whenever possible. Nevertheless, the improvement of transportation options is not the same as less transportation. How can an air trip halfway around the globe to complete a business deal that benefits no one but its executors be justified! It takes 26,000 pounds of jet fuel to fly a Boeing 727 from Houston to St. Louis.
Point 8. Reinvest In Smart Urban Growth: Revitalize urban centers to promote strong cities and good jobs, by rebuilding and upgrading local infrastructure including road maintenance, bridge repair, and water and waste water systems, and by expanding redevelopment of idled urban “brownfield” lands, and by improving metropolitan planning and governance.
Comment 8. Prof. Albert Bartlett wrote (and it’s too good to paraphrase) [http://www.oilcrisis.com/bartlett/reflections.htm]:
From the highest political and planning circles come various suggestions that are intended to address the problems caused by growth and thus to improve the quality of life. Many of these suggestions are “pseudo solutions” to the problems. At first glance, these sophistic solutions seem logical. A moment’s thought will show that, in fact, they are false.
The terms “growth management” and “smart growth” are used interchangeably to describe urban developments that are functionally and esthetically efficient and pleasing. Sometimes these planning processes are advocated by those who believe that we can’t stop population growth, therefore we must accommodate it as best we can. Other times they are advocated by those who are actively advancing population growth. The claim is made that growth management and smart growth “will save the environment.” They don’t save the environment. Whether the growth is smart or dumb, the growth destroys the environment. “Growth management” is a favorite term used by planners and politicians. With planning, smart growth will destroy the environment, but it will do it in a sensitive way. It’s like buying a ticket on the Titanic. You can be smart and go first class, or you can be dumb and go steerage. In both cases, the result is the same. But given the choice, most people would go first class.
The growth of our cities and the migration of their populations from the countryside in our country and, indeed, from other countries has been one of the greatest evils of the industrial revolution. To re-establish a sustainable society it will be necessary – not to re-vitalize the cities – but to dismantle them. This will be energy intensive enough without wasting energy on highways and unnecessary automobile bridges. Such industry as is retained – to serve humanity, presumable, not business (and profit) – should not employ workers as human resources in the same sense as coal and iron ore are resources. Instead, workers should be the owners of enterprises to which they are strongly attached by the activities the earnest pursuit of which represents their most compelling natural and unfettered interests. Thus, everyone can be near some activity that interests him (or her), and no one needs to be near every activity, which continues to be a principal justification for cities despite their accumulations of every imaginable pitfall and vice.
Point 9. Plan for a Hydrogen Future: Invest in long term research & development of hydrogen fuel cell technology, and deploy the infrastructure to support hydrogen powered cars and distributed electricity generation using stationary fuel cells, to create jobs in the industries of the future.
Comment 9. The ramifications of job growth have been discussed. But, what is meant by a hydrogen future? If it does not mean hydrogen from nuclear power – directly or through electricity – the Apollo Alliance should say so. If it does, the Apollo Alliance should admit that it does openly and prominently. This they do not do; but, very early in my analysis of energy in the Twenty-First Century, I realized that Hydrogen Economy means Nuclear Economy. No matter how you compute the maximum energy available from renewable energy (other than nuclear) it can never be sufficient to support a capitalist-style economy, i.e., an economy that requires economic growth to perpetuate political stability (and forestall the revolution foreseen by the Communist Party). Therefore, Capitalism Economy – with or without Conservation – implies Nuclear Economy. This will discussed in greater detail in the next section.
Preserve Regulatory Protections: Encourage balanced growth and investment through regulation that ensures energy diversity and system reliability, that protects workers and the environment, that rewards consumers, and that establishes a fair framework for emerging technologies.
Comment 10. Absolutely! Capitalism cannot exist without regulation no matter how much right-wing radicals chaff at that bit. Wiser heads among capitalists know that one can increase next quarter’s profits at the expense of the environment in nearly every industry almost always. Thus, to comply with a policy that is not quite suicidal they need someone to force their competitors to comply. The AA does not suggested abandoning the Profit Motive. Nevertheless, the reforms they recommend require central planning nearly to the degree that was practiced in the Soviet Union. However, the Ten-Point Plan is a ten-year plan rather than a five-year plan.
Commentary Continued: The Nuclear Option
The positive characteristics of nuclear are easy to dwell upon if one is an exponent of growth such as John McCarthy http://www-formal.stanford.edu/jmc/index.html or the late Julian Simon http://www.freedomsnest.com/simjul.html. On the other hand, they are likely to be ignored by Soft Energy zealots.
A Renewable Energy Resource
Regardless of the finiteness of uranium resources, nuclear energy must be considered renewable because of the existence of fast breeder reactors and the likelihood that their technological limitations will disappear over the coming decades. Therefore, nuclear power should be admitted to the competition with wind, solar, biomass, and other sustainable technologies. If there is some reason why nuclear energy is not sustainable, it has yet to be demonstrated. (What is not sustainable is growth itself – not nuclear energy.)
The Hydrogen Economy
Suppose that we agree that the hydrogen economy means hydrogen from nuclear power installations (NPIs). Suppose that we agree that the hydrogen economy means hydrogen from nuclear power installations (NPIs). [However, see [http://www.phoenixprojectpac.us/user/Phoenix%20Project%20for%20America%20PAC.pdf] for a non-nuclear approach to the hydrogen economy.] In their article “Large-Scale Production of Hydrogen by Nuclear Energy for the Hydrogen Economy” [http://web.gat.com/pubs-ext/MISCONF03/A24265.pdf], K.R. Schultz, L.C. Brown, G.E. Besenbruch, and C.J. Hamilton suggest that hydrogen can be produced with a 50% efficiency by thermal splitting of water using a Sulfur-Iodine cycle in conjunction with the Modular Helium Reactor (H2-MHR). The efficiency of the H2-MHR bypasses the objections to using electricity as an intermediate step as discussed by Ulf Bossel, Baldur Eliasson and Gordon Taylor [http://www.oilcrash.com/articles/h2_eco.htm]. Other drawbacks of hydrogen have been addressed by Graham Cowan in his interesting paper Boron: A Better Energy Carrier than Hydrogen? [http://www.eagle.ca/~gcowan/Paper_for_11th_CHC.html]
Also, associated with the hydrogen economy and whatever residual industrial tasks cannot be converted to electrical power are the huge changes in our technological and industrial infrastructure associated with conversion to the use of hydrogen for fuel. This will involve energetically costly re-tooling for the production of different types of industrial equipment. Although the period of amortization can be prolonged, ultimately such costs must be charged to the energy invested in nuclear energy.
The cost of liquefying hydrogen might be paid in part at least by using hydrogen to facilitate transmission of electricity through ‘high-temperature’ superconducting transmission lines that might run through the middle of liquid hydrogen pipelines. I do not know if this is feasible nor do I have a reference for it as I have no idea if it exists outside of my own imagination. However, I have noticed that the fractional losses of electric power listed in the reference case from Annual Energy Outlook 2005 (Early Release) (AEO2005), published by the Energy Information Administration of the US Department of Energy (DOE), are rather large so that the potential savings, at least, are documented. (See Appendix A of AEO2005Full.pdf.) [Note. The term ‘high-temperature’ means that, while the temperature is still cryogenic, it is well above absolute zero.]
Energy Returned over Energy Invested (ER/EI)
If the Energy Returned by NPIs is less than the Energy Invested, nuclear energy is infeasible. Therefore, the frequently discussed ER/EI analysis is crucial to this discussion. Probably, the ER/EI ratio for nuclear power is less than comparable ratios for fossil fuels, which is a drawback insofar as market penetration is concerned; however, so long as it exceeds 1.0 the introduction of nuclear energy is feasible. There are a number of factors, however, that point to the possibility that ERoEI is less than 1.0. In particular, elsewhere in this section, a number of requirements of NPIs are mentioned that might be easy to overlook in an analysis of ER/EI.
The identification and quantification of every component, both direct and indirect, of the energy invested in nuclear power is not a simple thing to do. In particular, if any such study of Energy Invested includes the ancillary business expenses, including the expense of doing the very study in question, I have not seen it. But, in the American economy, for example, the energy consumed by commerce is 22% of the total energy budget. This is corroborated by employment statistics. (See [http://stats.bls.gov/oes/home.htm].)
Computation of Energy Invested by multiplying the sum of capital and operating costs by the ratio of Total National Energy Budget over Gross National Product (E/GDP) tabulated by the DOE provides an approximation to the correct value that does not omit the energy consumed by commerce. (See “Cash Flow in a Mark II Economy” [Mark-II-Economy.html].) Using cost data from the Shultz et al. study [http://web.gat.com/pubs-ext/MISCONF03/A24265.pdf], the University of Chicago Study [http://www.nuclear.gov/reports/NuclIndustryStudy.pdf], and the MIT study [http://web.mit.edu/nuclearpower/], I computed an ER/EI ratio of 4.63.
However, it is not clear that all ancillary costs have been included, e.g., desalination of sea water, remediation of environmental change, etc. A pro-rata share of the costs of providing and maintaining railways to carry heavy equipment, fuel, and waste, highways to transport workers, conduits to transmit electric current, pipelines to transport hydrogen, and easements through which electrical power lines and hydrogen pipelines can be run must be charged to the plant. Some locations for NPIs are unsuitable for this necessary infrastructure, and, therefore, unsuitable for NPIs.
At the start of this exercise, I considered the notion that I might be able to determine the feasibility of nuclear by looking at the energy balance for France. (http://www.eia.doe.gov/emeu/world/country/cntry_FR.html) France produces about three quarters of her electricity from nuclear, but France has to import about half of its energy. Is it possible that nuclear power consumes more energy than it produces? Despite the inclination to prove the affirmative, I have not been able to determine the answer to this question by looking at the available data. In fact, France seems to be doing rather well insofar as energy is concerned; and, therefore, is much less of a problem for the rest of the world than is the United States.
Finally, and we shall have to await a more thorough discussion of this topic, the author wonders if the cost of restoring the land and the water employed by NPIs to its pre-nuclear condition should be charged to the Energy Invested even if there is no possibility that the land will ever be used for any other purpose than nuclear power into the foreseeable future. Clearly, decommissioning costs must be included, but does decommissioning include restoring the land to its original condition as a beautiful, natural, wildlife habitat? Quite frankly, I believe that it does.
Money
Although the capital costs of NPIs are sufficiently high that market penetration under the standard short-sighted micro-economic model might be prohibitively difficult, as a fraction of the projected Gross Domestic Product they are quite manageable by a society that possesses the political will to manage them as we shall see in the sequel. The final irony might be that a capitalist-style market economy can be maintained under a centrally-planned socialist energy economy and only under such an economy.
Many people believe that the United States economy is in such bad shape, principally because of the trade deficit and the national debt, that it could not possibly support the massive spending necessary to install a hydrogen economy. If the government continues to run a deficit, the public costs of such a project might very well multiply that deficit by a large factor. While this may be true, it does not necessarily represent the prohibition of the Apollo Plan, so long as American workers are willing to accept government debt in the form of fiat money as payment of wages. This study shows that capital costs are well within the capabilities of the US economy. The results are presented as the final two computations done on the spreadsheet explained in the body of this report.
Unfortunately, nuclear facilities are operated sometimes for the personal profit of their owners, managers, and other stakeholders who might be inclined to place their personal interests ahead of other considerations such as good engineering practice and safety. Mere prudence dictates that we be suspicious of enterprises run for profit. Since it will require huge investments by the federal government to penetrate a market economy with current nuclear technology, the federal government might just as well own and operate whichever nuclear plants it chooses to subsidize. The Apollo Plan amounts to some sort of Socialism; hopefully, it will not be Corporate Socialism, i.e., Fascism. Thus, the evils of the profit motive can be avoided, but only by compromising Capitalism. However, as critics of Socialism will be quick to attest, this does not necessarily protect society from incompetence.
Water
NPIs need fresh water. Many experts believe that we are even closer to Peak Water than we are to Peak Oil if we are not past both. Since some experts disagree, this must be regarded as an open question. If fresh water is used as cooling water, it must be returned to the environment at the original temperature with all contaminants removed and all nutrients restored. If fresh water is split to produce hydrogen, it may end up as atmospheric water only part of which will return to Earth as fresh water, in which case the losses in our fresh water supply will have to be replaced somehow. If some of our NPIs are used to desalinate sea water, the energy expended must be subtracted from the Energy Returned in computing ERoEI.
As an example of water use by an existing nuclear power facility, nuclear Plant Hatch in Georgia withdraws an average of 57 million gallons per day from the Altamaha River and actually "consumes" 33 million gallons per day, lost primarily as water vapor, according to the U.S. Nuclear Regulatory Commission (http://www.cleanenergy.org/programs/water.cfm). Plant Hatch, consisting of two 924 MWe reactors each with a capacity factor of 0.8453, consumes water at the rate of 3.2903 x 10¹¹ kgs/emquad. Thus, if every NPI in the year 2100 used water at the rate Hatch Plant did in 2000, we would need 1.1442 x 10¹⁵ kgs of water per year to satisfy the modest economic growth assumed in my Reference Case for the Conservation-within-Capitalism Scenario. According to http://www.american.edu/TED/water.htm, we have about 3 x 10¹⁵ kilograms of renewable fresh water total. Thus, power plants would use more than one-third of all of our renewable fresh water. According to http://oldfraser.lexi.net/publications/critical_issues/1999/env_indic/resource_use.html, the US has 2.5 trillion cubic meters of water or 2.5 x 10¹⁵ kgs, which corroborates the previous estimate. Also, see http://www.worldwater.org/table1.html.
Some of the energy produced can be used to desalinate sea water for reactors on our East, West, and South coasts where the population is dense and fresh water dear. Moreover, energy from ocean waves can be used to assist desalination. [http://www.malibuwater.com/OceanWaveEnergy.html] Let us compute a lower bound for the energy cost of desalination of sea water to make the case against nuclear as conservative as possible. According to Allan R. Hoffman (GlobalWater.htm), “energy requirements, exclusive of energy required for pre-treatment, brine disposal, and water transport, are: reverse osmosis: 4.7 – 5.7 kWh/m3 and multi-stage flash: 23 – 27 kWh/m3”. To establish a minimum, I shall use 4.7 kWh/m3 to obtain
![]()
![]()
i.e., an increase in Energy Invested of 1.6% of the Energy Returned, which should not present a problem. However, if the higher value for multi-stage flash were the best one could do, the costs would soar to nearly 9% of the Energy Returned. If the ratio of Energy Returned to Energy Invested (ERoEI) were 5.0, the energy costs would increase by 44.9% and the ERoEI would be reduced to 3.45, which would certainly be an unwelcome surcharge on nuclear power. In addition to the costs of pre-treatment, brine disposal, and transport, the cost of desalinating water to be split into hydrogen and oxygen would have to be borne. The cost of transport might be considerable if sea water were needed in Minneapolis, say, but the scarcity of fresh water is most acute in places much closer to the ocean. The calculation of these additional costs shall be postponed to some future study.
Land
The final limitation upon economic growth is the area of the surface of Earth. NPIs require a smaller fraction of Earth’s surface per unit of power generated than any of the competing technologies, namely, wind, solar, and biomass – despite the fact that solar and wind power installations can coexist with other land uses. Even if every other obstacle to growth were removed, ultimately we should run out of space – unless some means of miniaturizing NPIs, for example, should be discovered such that the rate of increase of power density could keep pace with growth. (If emquads per square meter increases at the same rate as emquads, we would be able to produce the energy budget of the future in the space we use now.) Even in the unlikely event that NPIs could be stacked, a limit would be reached after which they could be stacked no further without the expenditure of more energy than an NPI can produce during its lifetime. Also, there are limits to power density that, if none other could be found, would be set by the atomic nature of matter – although, admittedly, if the concentration of the space per unit of power were limited by atomic considerations alone, growth might continue for a very long time. Probably, though, by the time the individual Earthling could wear an NPI strapped to his wrist like Dick Tracy wore a radio, we shall no longer be living on Earth, a situation to be deplored for other reasons as stated previously.
To return, for a moment, to more realistic considerations, the land needed for NPIs includes not just the plant sites and infrastructure for transportation and power transmission but also the space occupied by facilities for mining and enrichment, fabrication, maintenance, recycle, hydrogen compression and liquefaction, waste management, sea water desalination, fresh water remediation, and the ubiquitous office buildings that seem to be a necessary part of every enterprise engaged in the pursuit of profit. Engineers and scientists will need workplaces; and, if I am not mistaken, the greater the complexity of our energy economy the greater the superstructure of command and control, which, in the case of nuclear, must be multiply redundant. Moreover, many areas on the face of the Earth are not suitable for NPIs, namely, the tops of mountains, earthquake zones, crowded cities (perhaps), and, if we wish to observe the ethical treatment of animals, wildernesses, swamps, prairies, etc. – in short, any place where humans have not yet evicted animals from their natural habitats, which, for all practical purposes, amounts to saying that future nuclear installations may be placed nowhere. Finally, it must be decided whether the space occupied by outmoded and obsolete facilities can be reused for new facilities or if it must be restored to the pristine condition in which Nature bequeathed it to us. If the latter, the energetic costs will very likely overwhelm the Energy Returned in the ratio (or difference) represented by ERoEI, which brings me to the next point:
Danger
Quite obviously, while operating as designed, nuclear power plants do not contribute directly to Global Climate Change nor air and water pollution regardless of the effect of their ancillary facilities, e.g., mining, etc. When nuclear facilities are operated properly, the dangers are rather minimal; nevertheless, nuclear radiation is extremely dangerous. In addition to radiation poisoning, nuclear plants have a non-zero, but very small, probability of exploding; but, if there are many of them, the probability of explosion increases accordingly. Admittedly, there is no physical reason why the problems associated with pollution, radiation, explosions, waste, and decommissioning cannot be solved, however they must be solved; and, to the extent that they have not yet been solved, they represent impediments to the introduction of nuclear power and the hydrogen economy, which brings us to the next topic.
Complexity
Nuclear power is the key to a much larger and complicated economy with much greater opportunities for unanticipated environmental catastrophes both because it makes a larger economy possible and because it makes a more complicated economy necessary to supply an energy budget that is growing exponentially. Now, the economy is sufficiently complicated in 2005 that the average person must necessarily depend upon the opinions of experts to determine which public policies are in his best interests and which are not. Moreover, experts disagree. The average man or woman is held hostage to the complexity of the economy, and this situation is not conducive to democracy. Soon enough, under a scenario of modest growth, this situation will be exacerbated many times over. The interests of ordinary private individuals will be taken out of their own hands almost completely. Presumably, a technocracy is better than a plutocracy (unless technocrats become plutocrats); but, in either case, it represents social degeneration – not progress.
Arithmetical and Logical Absurdities in THE APOLLO JOBS REPORT
The following is a discussion of a document with multiple titles, namely, New Energy for America, The Apollo Jobs Report: Good Jobs and Energy Independence for America, published by the Apollo Alliance http://www.apolloalliance.org/docUploads/ApolloReport%5F022404%5F122748%2Epdf . The large number of absurd statements in this document can be attributed principally to two aspects of typical flat-earth economics: (i) the notion that growth within a finite world is sustainable into the indefinite future, and (ii) the idea that one can conserve energy by increasing economic activity. In addition, I personally object to the well-known political fallacy whereby tyranny is referred to as leadership. Let us open the document and see how this is played out.
On page 3, we read “The American economy will not grow its way out of problems thirty years in the making without real political leadership.” This is merely a dishonest way of saying, “America will grow its way out of problems that began with the resignation of Richard Nixon if only you send your money to the Apollo Alliance – especially if you expect to retain any political influence in an energy policy that is going to be determined by us.” It is absurd to imagine that we can grow our way out of our fundamental problem which is growth itself. Political leadership is doubletalk for most people being told what to do by a few people (tyranny) rather than making the decisions that affect themselves by themselves (freedom). Our problems began in prehistory probably, but certainly no later than the dawn of the industrial revolution.
“The new Apollo Project is based on the recognition that clean energy can be the next great engine of jobs and growth …” begins the very next sentence albeit in a new paragraph. I believe I understand what is meant by the metaphor “the next great engine of jobs and growth”. The absurdities of “jobs and growth” in a finite world has been discussed, however it might be worthwhile mentioning the equivocation inherent in the little phrase “recognition that clean energy can be”. The word ‘recognition’ implies the existence of a self-evident fact, which is by no means the case; but, the word ‘can’ rather than ‘will’ (although ‘can’ is replaced by ‘will’ further on in the same sentence) makes the sentence true technically despite the deception and the absurdity. Indeed, the Apollo Project could have a similar effect upon the economy as, for example, war by stimulating the economy (temporarily) with government spending at the expense of increased debt – except that the result of the spending would not be wasted as it would be if it were spent on war. It is slightly dishonest to present “clean energy” as a tool that will give some people more money whilst furthering their natural xenophobic tendencies by providing “energy independence” from those nasty foreigners, whereas the honest approach is to present clean energy is a necessary feature of continued life on this planet without unbearable misery for humans and animals during a period wherein population has not been reduced yet to sustainable levels and harmful industries have not yet been Powered Down.
On page 8 we read:
Like the telecommunications revolution before it, the industries necessary to meet the goals of Apollo on average pay higher wages and provide better benefits such as health care and retirement, crossing a wide spectrum of industry sectors, from skilled craftsmen, to designers and engineers, from public employees to laborers. Increased investment and access to capital can be used as tools for economic development, increasing local investment within communities, stabilizing basic industries to retain jobs, and creating new markets that build entirely new industries. By reinvesting in our industrial jobs base and focusing on new construction and new infrastructure and public investment, these jobs can also help create and retain good union jobs that ensure family supporting wages.
All of this sounds good; however, at the risk of repeating myself, let me remind the reader that most of our problems stem from the lavish lifestyles of Americans, which, as Mr. Cheney pointed out, “are not negotiable”. These remarks promise even higher standards of living, which, as this study will show, would not “reduce national energy consumption by 16%”, as stated on page 8 of The Apollo Jobs Report, but rather would increase energy consumption exponentially if the promises could be kept.
Also on page 8 we read:
Transportation infrastructure improvements will also create substantial employment in sectors with good pay and benefits. New transit system starts, maintenance of the nation’s passenger train system, development of regional high speed rail networks, and improvements in the nation’s roads and highways will all generate significant numbers of jobs in basic industries. Infrastructure investments also guarantee that spending is made locally, directly stimulating the domestic economy, supporting small business and regional labor markets. [italics mine]
While these remarks seem to encourage mass transit, they may, in fact, merely encourage travel. Moreover, as Steven Koonin points out in “A Physicist's View of the World's Energy Situation” (http://vmsstreamer1.fnal.gov/VMS_Site_03/Lectures/Colloquium/050413Koonin/index.htm), more efficient transportation will, almost certainly, result in more travel even if standards of living do not rise. However, with more money to spend, it is difficult to imagine that Americans will spend less time in their cars or make shorter trips. Nothing has been done to discourage the automobile culture, which to Americans, represents much more than transportation, e. g., political billboards, status, etc. Finally, if communities become more attractive due to local investment, the usual result is that more people will be attracted to them, as Al Bartlett pointed out (http://www.oilcrisis.com/bartlett/reflections.htm), which neutralizes decentralization and such improvement in the quality of life in the community as may have occurred. The same can be said for the following remarks on page 15:
Rebuilding our cities will increase the levels of municipal services, and improve job access and mobility for urban workers. Regional transportation planning and infrastructure investment is good energy policy, good environmental policy, and good for America’s working families.
Again, on page 28, we read Section D.6 Invest in Existing Road Maintenance, which emphasizes (again) economic activity for its own sake while admitting that “[t]ransportation policy affects the number of vehicle miles traveled and consumption of petroleum” without saying whether they decrease or, more likely, increase.
Perhaps, it would be useful at this juncture to remind the reader of one or two characteristics of markets in a market economy – especially in view of the occasional word of advice one reads on Peak-Oil-oriented list servers concerning opportunities in investment offered by the fundamental reality of Peak Oil. The market is extremely short sighted. Even the commodity futures market does not look much beyond eighteen months. Just like the food market that sells us food so very cheaply and might continue to do so almost until the day before there is none, the petroleum and fuels markets, for example, although quite bullish lately (early 2005), can turn suddenly upon the unwary investor and retreat for sufficiently long periods to ruin an investor with ‘weak hands’ despite the fundamentals. Americans might be able to purchase gasoline relatively cheaply until practically the day before there is none.
On page 33:
Finally, efficiency offers real savings to consumers, meaning that working families have more money to spend on other goods and services within their local economies rather than spending money on expensive energy imports that drain local resources.
Once again, in a final example of absurdities in The Apollo Jobs Report, the Alliance seems to be unaware of the energy associated with all “goods and services” or is pretending to be unaware of it. In fact, when Americans buy domestically-made products in 2005, they are purchasing approximately 2.8 kilowatt-hours per US dollar; when they purchase $50 foreign oil, they purchase approximately 34 kilowatt-hours per US dollar! Despite its advisability, energy independence per se will lower the (average) American standard of living.
Computations for the Conservation-within-Capitalism Scenario
Assumptions
Energy and Money
When discussing an entire economy or a median transaction within an economy it is valid to relate energy and money at a given time according to the ratio of total energy budget to Gross Domestic Product. Samuelson [http://www.mskousen.com/Books/Articles/perserverance.html] tells us that GDP represents the rate at which money flows through an economy. Its correct units are dollars per year. The correct units of total energy budget are emquads per year (emjoules per year, thermal terawatt-years per year, etc.) although the DOE refers to coal equivalent quads as simply quads and suppresses the “per year” since it is understood that both GDP and the energy budget are yearly figures. In the E/GDP ratio, ‘years’ cancel out to give emquads per trillion US dollars, say. [Note 05.13.08. This was proved numerically in “Energy in a Mark II Economy”.]
Standard of Living Ratio
The average standard of living is best represented as the ratio of total energy budget corrected for conservation but not for the intelligence of the consumer, which seems to be impossible, divided by the total population in billions of people, say. We shall see how to correct for conservation in the sequel. The standard of living ratio is assumed to increase exponentially throughout the Twenty-First Century at the rate at which it increases during the first ten years principally due to the conservation measures advocated by the Apollo Alliance.
Exponential Change
We agree that all change is exponential change. Even that which remains constant is growing at an exponential rate except that the exponent is zero.
Maximum Renewables
Following Pimentel et al. Pimentel.pdf, we assume that the total energy we shall receive from renewable energy (other than nuclear energy, geothermal energy, and hydroelectric power) is bounded above at 45.7 quads of coal equivalents or emquads per year – except that we allow for a very slight yearly increase beyond this. The limit suggested by Pimentel is reached quickly with an Apollo-like effort; but, because the ingenuity of man is boundless, the energy from renewables increases each year thereafter. However, because Earth is bounded, the increase after current technology has been fully exploited is very slight.
Wind Power
According to http://www.nrel.gov/wind/wind_potential.html, “The amount of windy land available for power class 4 and above is approximately 460,000 square kilometers, … If future generation technology is utilized to take advantage of areas with wind resource class 3 and higher, then the amount of windy land available is over 1,000,000 square kilometers …”. According to Ted Trainer of the University of New South Wales (http://www.arts.unsw.edu.au/tsw/D89.RE.Ch.4.Wind.html), a wind power installation of 1000 MW with a capacity factor of 0.8 requires 1570 square kilometers (km2). Some crops can share some areas appropriate for wind power installations, but most people would not wish to live very close to an industrial-strength wind turbine, principally because of the noise. Although I have decided to employ the study of Pimentel et al. for renewable energy, I have used these estimates to establish limits on energy from wind independently of the Pimentel et al. study.
This analysis corroborates the estimates by Pimentel et al. who have determined that by 2050 the United States can harvest only 7 emquads yearly from wind power. Since

we shall require
![]()
which amounts to more than one-third of the 460,000 km2 of the land area of the United States with winds of Class 4 and higher, which are “suitable for development with advanced wind turbine technology”.
The Pimentel et al. study is probably on the high side since most of this area has been appropriated for other purposes in all likelihood. On the other hand, if all of the land with winds of Class 3 or higher could be devoted to wind power installations with the density computed by Trainer, we would harvest only
![]()
which is insufficient to support the Conservation-within-Capitalism Scenario.
Solar Power
Pimentel et al. (Pimentel.pdf) have estimated that the United States can harvest at most 11 emquads (per year) of photovoltaic power by 2050. This will require 30,000 km2 that cannot be used to grow plants. One hears the phrase “a million solar roofs”. Even if the average area were 1000 square meters per roof, this would provide between 0.38 emquads yearly according to my Figure 2 copied from http://www.physicstoday.org/vol-57/iss-7/p47.html and 1.1 emquads yearly according to my computation of 0.0011 emquads per km2, which, although insufficient to affect a capitalist-style economy, should not be rejected by those who can afford to neglect market forces. According to http://www.eia.doe.gov/emeu/cbecs/pba99/comparenumber.html there were approximately 4.7 million commercial buildings in the U.S. in 1999. If the average commercial building could provide 10,000 square feet of photovoltaic solar panels, no more than 4.8 emquads could be harvested yearly according to my overly generous computation, which agrees with the number for 20% efficiency measured at the solar cell in Figure 2. Finally, according to http://www.eia.doe.gov/emeu/efficiency/ee_ch3.htm there are over 90 million households in single-family and multiple-family buildings with an average of about 1800 square feet per household. Presumably, there were fewer than 100 million households. If we neglect the fact that not every household lives under its own roof, we compute an upper limit of 18.4 emquads yearly corresponding to 1800 square feet of photovoltaic surface for every household. Clearly, the improvement in this number could be proportional to population growth or slightly better if the efficiency of solar cells improves, however such improvements are insufficient to support the Conservation-within-Capitalism Scenario.
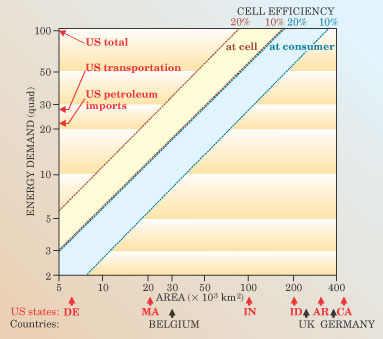
Figure 2. Energy density for solar
Certainly solar power can share the area occupied by buildings, but it cannot share all of the land area between the buildings, which is likely to continue to be most of the land area into the foreseeable future. (We should not expect Earth to morph into the planet Coruscant in “The Attack of the Clones”, which, if you remember, was completely covered by a single city.) Moreover, if the buildings were to cover an appreciable fraction of our land area, the attendant energy requirements of such a high concentration of human life would overwhelm the power of the insolation even if we were able to harvest all of it. The proof or refutation of this will have to be deferred to another paper.
Other Renewable Energy
Pimentel et al. (Pimentel.pdf) discuss the various renewable energy technologies listed in Table 1 (below) together with the estimated maximum contribution by 2050. These are very generous upper bounds; however, new ideas for renewable energy technologies are appearing almost daily. Because the stakes are so high, new ideas will require careful analysis even if they seem impractical. In my spreadsheet calculations, I have used the 45.7 emquads in 2050 computed by Pimentel et al. regardless of overlap with the category referred to as other by the DOE, which includes hydroelectric and geothermal if I am not mistaken. Please note that, even if I had doubled or tripled the Pimentel numbers shown in Table 1, the results for the Conservation-within-Capitalism Scenario would be nearly the same by the end of the Twenty-First Century.
|
Energy technology |
Billion kilowatt-hours |
Emquads |
Million square kilometers |
|
Biomass |
1455.0 |
5 |
1.02 |
|
Hydroelectric power |
1455.0 |
5 |
0.33 |
|
Geothermal energy |
349.2 |
1.2 |
0.01 |
|
Solar thermal energy |
291.0 |
10 |
0.11 |
|
Photovoltaics |
3201.0 |
11 |
0.03 |
|
Wind power |
2037.0 |
7 |
0.08 |
|
Biogas |
145.5 |
0.5 |
0.0001 |
|
Passive solar power |
1746.0 |
6 |
0.01 |
|
Total |
10,679.7 |
45.7 |
1.5901 |
Table 1. Maximum renewable energy in 2050
Diagram of the Log of GDP, GDC, Trade Deficit, and Exports from 2005 to 2050
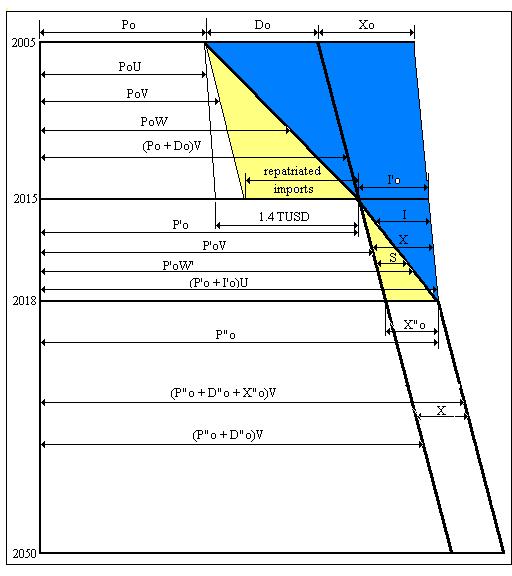
Figure 3. Diagram of the Log of GDP, GDC, Trade Deficit, and Exports from 2005 to 2050
Legend
|
Label |
Description |
|
GDP |
Gross Domestic Product in trillions of chain-linked 1996 US dollars (TUSD) Call them ‘terabucks’. |
|
P |
Shorthand for Gross Domestic Product, TUSD |
|
Po |
Gross Domestic Product in 2005, TUSD |
|
P′ o |
Gross Domestic Product in 2015, TUSD |
|
P″o |
Gross Domestic Product in 2018, TUSD |
|
D |
Trade Deficit in TUSD |
|
Do |
Trade Deficit in 2005, TUSD |
|
D′o |
Trade Deficit in 2015, TUSD, equal to zero |
|
D″o |
Trade Deficit in 2018, TUSD |
|
X |
Export of Goods and Services, TUSD |
|
Xo |
Exports in 2005, TUSD |
|
X′o |
Exports in 2015, TUSD |
|
X″o |
Exports in 2018, TUSD |
|
I |
Import of Goods and Services, TUSD |
|
I′o |
Imports in 2015, TUSD |
|
S |
Trade Surplus, the negative of the Trade Deficit, that is, a positive quantity when the deficit is negative, TUSD |
|
GDC |
Gross Domestic Consumption = GDP + Imports – Exports = GDP + Deficit, TUSD |
|
U |
The exponential function of rate, rp, and time, t |
|
V |
The exponential function of rate, rp + r1, and time, t |
|
W |
The exponential function of rate, rp + r1+ rd, and time, t |
|
W′ |
The exponential function of rate, rp + r1+ r′d, and time, t |
|
rp |
The expected rate of increase of GDP in DOE’s reference case in the Annual Energy Report 2005 |
|
re |
The expected rate of increase of the energy budget in DOE’s reference case in the Annual Energy Report 2005 |
|
r1 |
The additional rate of increase in GDP due to the economic activity advocated by the Apollo Alliance |
|
rd |
Additional rate of increase in GDP to repatriate imports to erase the trade deficit by 2015 |
Table 2a. Legend for Diagram in Figure 3 and Spreadsheet Table 3, Part 1
|
Label |
Description |
|
r′d |
Altered value of rd to bring imports to zero in 2018 |
|
rP |
rp + r1 + rd |
|
|
|
|
E |
Domestic energy budget in emquads |
|
Eo |
Domestic energy budget at beginning of period under consideration, emquads |
|
E1 |
Eoexp(ret) |
|
αtp =Eo,tp/Po |
Weighted average of E/GDP for our trading partners at beginning of period under consideration (emquads/TUSD) |
|
αd = Eo/Po |
Domestic energy budget over GDP at beginning of period under consideration (emquads/TUSD) |
|
Ф |
Ratio of weighted average of E/GDP for our trading partners to the domestic value of E/GDP at beginning of period |
|
phi |
Spreadsheet name for Ф |
|
delta |
Spreadsheet name for W – V |
|
bracket |
Spreadsheet name for [1 + Ф*(W-V)] |
|
ao |
Fraction of energy demand for all sectors except transportation sector at beginning of period of interest |
|
ra |
Rate of reduction of energy for everything except transportation to achieve 20% savings between 2005 and 2015 |
|
A |
ao exp(rat) |
|
bo |
Fraction of energy demand for transportation sector at beginning of period of interest |
|
rb |
Rate of reduction of energy per passenger or freight mile to achieve 50% savings between 2005 and 2015 |
|
B |
bo exp(rbt) |
|
k |
A + B |
Table 2b. Legend for Diagram in Figure 3 and Spreadsheet Table 3, Part 2
|
Label |
Description |
|
r2 |
The additional rate of increase in E due to the economic activity advocated by the Apollo Alliance |
|
Ea |
Energy demand from all sectors except transportation |
|
Eb |
Energy demand for transportation |
|
new E |
Ea + Eb until 2015, E/k after 2015 |
|
E/GDP |
Energy demand over Gross Domestic Product (emquads/TUSD) |
|
coal |
Energy from coal produced domestically, emquads |
|
oil |
Energy from oil produced domestically, emquads |
|
gas |
Energy from gas produced domestically, emquads |
|
NGPL |
Natural gas plant liquids, emquads |
|
renewables |
Wind power and solar photovoltaic power principally, emquads |
|
other |
Hydroelectric, firewood, bio-fuels, etc. , emquads |
|
DOE nuclear |
Nuclear power under expectations for growth that ignore Peak Oil completely, emquads |
|
E I |
Energy imports (principally oil), emquads |
|
E X |
Energy exports, emquads |
|
E D |
Energy trade deficit = E I – E X , emquads |
|
E supply |
Domestic energy production assuming unexceptional growth in nuclear + Energy imports – Energy exports, emquads |
|
E demand |
Same as new E, emquads |
|
E deficit |
E demand – E supply, emquads |
Table 2c. Legend for Diagram in Figure 3 and Spreadsheet Table 3, Part 3
|
Label |
Description |
|
elec demand. |
Electricity demand assumed to be 40% of total demand, emquads |
|
elecNMbR |
Electricity demand not met by renewables, emquads |
|
total nuc. |
Total nuclear = DOE nuclear + E deficit, emquads |
|
nuclear_e |
Electricity from nuclear power installations, emquads |
|
A/equad |
Square miles of plant area per emquad of electrical output |
|
area_e |
Surface area of Earth necessary to produce electricity from nuclear, square miles |
|
nuclear_H |
Hydrogen from direct thermal splitting of water in nuclear power facilities, emquads |
|
A/Hquad |
Square miles of plant area per emquad of hydrogen produced |
|
area_H |
Surface area of Earth necessary to produce hydrogen from nuclear, square miles |
|
tot. area |
Total area devoted to nuclear facilities, square miles |
|
NPI |
Total number of nuclear power facilities if average capacity is 1000 MW(e) per nuclear power installation |
|
MW(e) |
Megawatts of electrical power production capacity whether electricity or hydrogen is produced |
|
GDCon |
Gross Domestic Consumption = GDP + Imports – Exports, TUSD |
|
pop in Gcap |
Population of the United States in billions of people (capita), pronounced ‘gigacaps’ |
|
Econsumed |
Energy consumed = Energy demand + αtp I – αd X, emquads |
|
k |
A + B |
|
Ec std.liv. |
Energy consumption corrected for conservation (or lack of conservation), emquads |
|
Ec/Gcap |
Energy consumed per capita, emquads/Gcap |
|
Estdliv/Gcap |
Standard of living ratio = Ec std.liv. in emquads divided by population in Gcap |
|
r_n_hat |
Rate of exponential growth in Ec std.liv. |
|
Ec std livsum |
Ec std.liv. computed from E demand and trade data corrected for lack of conservation (if necessary), emquads |
|
Ecstdlive^rnhat |
Ec std.liv. computed from exponential rate of increase r_n_hat |
Table 2d. Legend for Diagram in Figure 3 and Spreadsheet Table 3, Part 4
Explanation of Diagram
Nearly all of the arithmetical computations in this study can be understood by studying Figure 3 above. The horizontal axis represents the logarithm of monetary values; the vertical axis represents time in years with the present at the top and the future at the bottom. Neither axis is drawn to scale. Nevertheless, exponential growth can be represented by straight lines on semi-log paper, therefore the straight line segments representing economic activity during the three periods of interest in Figure 3 represent exponential growth and shrinkage. Regrettably, the primitive drawing technology mastered by this author is not sufficiently sophisticated that equation-mode characters such as the exponential function of a subscripted variable can be easily represented, therefore I have resorted to the expedient of naming the very few expressions necessary for this exercise with surrogate variables. (I might express the identical lament in the case of spreadsheets; however I am amazed that a large profit-oriented corporation such as the developer of Excel has done nearly as well as one good programmer might have done working alone.) Here is a compendium of mathematical expressions:
The Principal Period during which the Apollo Alliance Plan Is Assumed To Be Active, 2005-2015
![]()
Reference line for the Apollo Alliance prediction whereby 1.4 TUSD is added to the GDP:
![]()
Reference line for the repatriation of imports: (This line is parallel to the line segment representing growth in Gross Domestic Consumption.)
![]()
Line segment that represents exponential growth in GDP:
![]()
Line segment that represents growth in Gross Domestic Consumption: (Gross Domestic Consumption is C. C = P + I – X = P + D.)
![]()
Line segment that represents the growth in GDP + Deficit + Exports = GDP + Imports: (This line is parallel to the reference line for the Apollo Alliance prediction whereby 1.4 TUSD is added to the GDP.)
![]()
These are the principal mathematical expressions that are needed to write the equations for imports, exports, the trade deficit, and finally the energy balance itself during the period 2005 to 2015. The energy imports, exports, and deficit are assumed to be proportional to the corresponding item in the trade balance. The highly praiseworthy motive of the Apollo Alliance has been to achieve energy independence within some prescribed period of time, which might as well be taken to be ten years as ten years is mentioned as the period over which the policy of the Alliance is to remain active.
![]()
![]()
![]()


![]()
![]()
Most of us should have no objections to the principal goals for the initial ten-year period of the Apollo Alliance Ten-Point Plan unless they permit the population to grow at an even faster rate than otherwise, which might lead ultimately to a larger and more catastrophic Die-Off. This was discussed in a number of postings on a Peak-Oil listserver that have been summarized in “The Proposition that Conservation Is a Bad Thing as an Example of Reductio ad Absurdum”. First and foremost, the non-trivial conservation measures advocated by the Apollo Alliance are very likely the best, or better than the best, that are politically feasible in present-day America. The energy requirements per unit of productivity are to be reduced by 20% as are household energy requirements per household. Moreover, the energy requirements per passenger or freight mile or per worker commute (or other appropriate units that are chosen to represent the usefulness of transportation) are to be reduced by half. This reduction is to take place over a ten-year period and is to apply uniformly to domestic goods and services and repatriated imports. Secondarily, the trade deficit is to be erased during the ten-year period. The activities associated with the Apollo Alliance are expected to add 1.4 trillion US dollars to our Gross Domestic Product (GDP).
The rate of reduction of energy for everything except transportation to achieve 20% savings between 2005 and 2015 is ra, a negative number equal to one tenth of the natural log of 0.8. The rate of reduction of energy per passenger or freight mile to achieve 50% savings between 2005 and 2015 is rb, a negative number equal to one tenth of the natural log of 0.5. These conservation measures are reflected in the equation for energy demand by the term denoted by k = A + B. Erasing the trade deficit between 2005 and 2015 amounts to reducing the ratio of the Gross Domestic Consumption (GDC) to the GDP from its present value to 1.0 in ten years. Thus,

which determines the value of rd, which accounts for the increase in the GDP due to domestic production of goods and services currently produced abroad. The following equation determines the value of r1, which accounts for the increase in the GDP by 1.4 trillion USDs by 2015. This is taken to be an increase above and beyond the normal increase predicted by the DOE in their reference-case scenario presumably without reforms such as those associated with the Ten-Point Plan:
![]()
This equation determines r1 + rd from which rd may be subtracted to find r1. Finally, associated with the 1.4 TUSD there will be a definite amount of energy determined by the E over GDP ratio in 2015, as yet unknown but easily determined from the following equation, which determines the energy demand in 2015 and from which the proper value of r2, which accounts for the increase in the energy budget due to the activities advocated by the Apollo Alliance, can be determined:
![]()
The value of r2 is determined in the spreadsheet by trial and error until the value of E2015 from the above equation is matched by the value obtained from the equation for energy demand (further above). The area shaded light yellow in Figure 3 represents repatriated imports whereas the area shaded light blue represents imports as yet un-repatriated.
The Three-Year Period during which the Remaining Imports Are To Be Repatriated, 2015-2018
The remaining imports could have been repatriated in a period somewhat short of three years with the same rate of increase in GDP, however I do not wish to report data for fractional years. Therefore, I have adopted the expedient of adjusting rd slightly to make the repatriation period exactly three years. The new value is obtained by subtracting the constant value of r1 from one third of the natural log of Po + Io over Po. Please notice that the straight line representing the exponential growth of GDP (on semi-log paper) has a slightly different slope. A new value of r2 is selected by t xls rial and error to increment the energy budget sufficiently that the per capita energy budget corrected for conservation but not for the intelligence of the consumer, which is a fair measure of standard of living, continues to increase at the rate that matches the prosperity promised and delivered by the policies advocated by the Apollo Alliance. Please remember that the Apollo Alliance has focused to a great degree upon the notion of improvement of the standard of living of Americans – a notion not likely to be rejected out of hand by very many people. I have assumed that conservation measures have been incorporated to the maximum extent possible consistent with American middle-class and popular values and that no further credit can be taken for conservation even though the standard of living and population continue to grow. This is consistent with the notion of Conservation within Capitalism. On the other hand, I continue to assume that such changes as required by the Ten-Point Plan will continue to be made regardless of market forces, which amounts to an imposition of socialistic central planning upon what would otherwise be more or less pure American-style capitalism. (Under pure American-style capitalism, the reforms are not likely to be enacted. For example, electricity from nuclear power continues to be more costly than electricity from fossil fuel and, without central planning, would have some difficulty penetrating the market until such time as ‘necessity’ intervened.) During this period and afterward, the trade deficit is negative, that is to say we shall have trade surpluses regardless of the effect upon consumer prices.
The Rest of the Twenty-First Century
Subsequent to 2018, we may set rd equal to zero as no further repatriation of imports is necessary. Moreover, k and the bracket are both one, therefore the expression for energy growth becomes particularly simple:
![]()
where a new value of r2 is chosen by trial and error to perpetuate the increases in standard of living enjoyed between 2005 and 2018. The reader will notice that our exports continue to grow. This is consistent with the Apollo Alliance’s intention to make American-made goods increasingly attractive to the rest of the world. This is about all we can expect to learn from Figure 3. To continue, we must study the spreadsheet calculations only a few of which have been explained so far. For the convenience of the reader, I shall present the spreadsheet in two ways:
1. The complete spreadsheet will be put on-line at CwC-ReferenceCase.xls. This version can be altered by anyone who takes the trouble to download it and save it under a different name, say. Most particularly, the reader may examine the formulas and perhaps find mistakes. The author has no desire to hide anything from the reader.
2. I shall enter the spreadsheet values in Table 3, an ordinary Word 2003 table.
The following section constitutes an explanation of the rest of the spreadsheet calculation that is the centerpiece of this paper. The spreadsheet is presented in Table 3, which is broken into fourteen sections, Table 3a – 3n.
Further Explanation of Calculations
|
Year |
GDP |
E/GDP tp |
Io |
Xo |
Do |
|
2003 |
10.381 |
15.982 |
|
|
|
|
2004 |
|
15.982 |
|
|
|
|
2005 |
11.045 |
15.982 |
|
|
|
|
2006 |
11.494 |
15.982 |
|
|
|
|
2007 |
11.962 |
15.982 |
|
|
|
|
2008 |
12.449 |
15.982 |
|
|
|
|
2009 |
12.956 |
15.982 |
|
|
|
|
2010 |
13.483 |
15.982 |
|
|
|
|
2011 |
14.032 |
15.982 |
|
|
|
|
2012 |
14.603 |
15.982 |
|
|
|
|
2013 |
15.197 |
15.982 |
|
|
|
|
2014 |
15.815 |
15.982 |
|
|
|
|
2015 |
16.459 |
15.982 |
|
|
|
|
2016 |
17.087 |
15.982 |
0.3215 |
0.3215 |
0.0000 |
|
2017 |
17.739 |
15.982 |
0.3215 |
0.3215 |
0.0000 |
|
2018 |
18.416 |
15.982 |
0.3215 |
0.3215 |
0.0000 |
|
2025 |
23.541 |
15.982 |
0.0000 |
0.1305 |
-0.1305 |
|
2050 |
56.582 |
15.982 |
0.0000 |
0.1305 |
-0.1305 |
|
2100 |
326.864 |
15.982 |
0.0000 |
0.1305 |
-0.1305 |
Table 3a.
Most of the initial data for the calculations on spreadsheet CwC-ReferenceCase.xls (and Table 3) have been obtained from the reference case from Annual Energy Outlook 2005 (Early Release) (AEO2005), published by the Energy Information Administration of the US Department of Energy (DOE). (See Appendix A of AEO2005Full.pdf.) In particular, the Gross Domestic Product (GDP) for 2003 in trillions of US 1996 chain-linked dollars (TUSD) can be found in Table A2. Using this figure, the trade data in the CIA Factbook (http://www.cia.gov/cia/publications/factbook/ ) can be normalized. These data can be understood by means of the following equation for Gross Domestic Consumption (GDC):
GDC = GDP + imports - exports,
C = P + I – X,
where imports minus exports is the well-known trade deficit.
|
Year |
Po + Do |
Po+Do+Xo |
imports |
exports |
deficit |
|
2003 |
|
|
1.1867 |
0.6749 |
0.5118 |
|
2004 |
|
|
|
|
|
|
2005 |
10.8928 |
11.5677 |
1.2626 |
0.7181 |
0.5445 |
|
2006 |
11.5895 |
12.3076 |
1.2006 |
0.6918 |
0.5088 |
|
2007 |
11.5895 |
12.3076 |
1.1326 |
0.6630 |
0.4695 |
|
2008 |
11.5895 |
12.3076 |
1.0580 |
0.6315 |
0.4265 |
|
2009 |
11.5895 |
12.3076 |
0.9767 |
0.5971 |
0.3795 |
|
2010 |
11.5895 |
12.3076 |
0.8881 |
0.5598 |
0.3284 |
|
2011 |
11.5895 |
12.3076 |
0.7919 |
0.5192 |
0.2727 |
|
2012 |
11.5895 |
12.3076 |
0.6876 |
0.4752 |
0.2124 |
|
2013 |
11.5895 |
12.3076 |
0.5747 |
0.4278 |
0.1470 |
|
2014 |
11.5895 |
12.3076 |
0.4529 |
0.3766 |
0.0763 |
|
2015 |
11.5895 |
12.3076 |
0.3215 |
0.3215 |
0.0000 |
|
2016 |
16.4590 |
16.7805 |
0.2218 |
0.2622 |
-0.0405 |
|
2017 |
16.4590 |
16.7805 |
0.1147 |
0.1986 |
-0.0839 |
|
2018 |
16.4590 |
16.7805 |
0.0000 |
0.1305 |
-0.1305 |
|
2025 |
18.2854 |
18.4159 |
0.0000 |
0.1668 |
-0.1668 |
|
2050 |
18.2854 |
18.4159 |
0.0000 |
0.4010 |
-0.4010 |
|
2100 |
18.2854 |
18.4159 |
0.0000 |
2.3163 |
-2.3163 |
Table 3b.
To calculate the additional energy consumption associated with the operation of industrial facilities to be constructed in the United States to manufacture goods that are currently imported, I shall make use of a simple device: In 2003, the energy budget of China was 49.49 emquads, whilst the GDP was 1.4099 trillion USD, which gives 35.1 emquads/TUSD; whereas the comparable figure for the US was 9.46 emquads/TUSD (Table 3d). Since goods made in China incorporate much more energy per USD, we should expect US prices to exceed the price of comparable goods manufactured in China by a factor of 3.71. Let us compare the price of a piece of rolling luggage ($87) imported from China to the cost of an American-made piece of luggage ($400) of approximately the same intrinsic value. The American price exceeds the price of the import by a factor of 4.6, which tends to validate our calculations for estimates like this where accuracy is neither expected nor required.
Currently, China accounts for about 13.35% of our total imports of 1.2626 TUSD; therefore the addition to US energy consumption associated with these imports would be 5.92 emquads. It is understood, then, that the low prices of imports from China do not reflect low embodied energy. Rather they reflect cheap labor that allows a large part of the revenue from these goods to be used to pay for energy, which in the case of coal, for example, is mined efficiently by hazardous and environmentally destructive methodologies. Sometimes it’s a good idea to see “what’s on the other end of the fork”.
If we do this calculation for our top fifteen trading partners and take the weighted average of the results, we compute 15.982 emquads/TUSD. These fifteen trading partners account for 75.39% of our imports. Suppose we account for the remaining 24.61% of 1.2626 TUSD by employing this average value of emquads/TUSD. This is the value of E/GDP tp in the third column of Table 3a. Many readers will wonder why this variable remains constant throughout the calculation. The reasons are two in number chief of which is that I have no idea how it may change. The second reason is that as some of our traders improve the standards of living of their people at the expense of the energy per dollar ratio (wage inflation) we are almost certain to look for new trading partners who deliver more bang for the buck.
The values of the economic variables in this calculation are computed from exponential relationships referred back to the value of the same variable at the beginning of the time period of interest, therefore it has been expedient generally to devote an entire column of the spreadsheet to the initial values, Io, Xo, Do, Po, Eo, etc..
|
Year |
GDC |
rd |
rp |
re |
delta |
|
2003 |
|
0.000000 |
0.031 |
0.014 |
|
|
2004 |
|
|
|
0.014 |
|
|
2005 |
11.589529 |
0.004812 |
0.031 |
0.014 |
0.000000 |
|
2006 |
12.003271 |
0.004812 |
0.031 |
0.014 |
0.004996 |
|
2007 |
12.431783 |
0.004812 |
0.031 |
0.014 |
0.010374 |
|
2008 |
12.875593 |
0.004812 |
0.031 |
0.014 |
0.016156 |
|
2009 |
13.335247 |
0.004812 |
0.031 |
0.014 |
0.022364 |
|
2010 |
13.811311 |
0.004812 |
0.031 |
0.014 |
0.029023 |
|
2011 |
14.304369 |
0.004812 |
0.031 |
0.014 |
0.036158 |
|
2012 |
14.815030 |
0.004812 |
0.031 |
0.014 |
0.043797 |
|
2013 |
15.343921 |
0.004812 |
0.031 |
0.014 |
0.051966 |
|
2014 |
15.891693 |
0.004812 |
0.031 |
0.014 |
0.060695 |
|
2015 |
16.459021 |
0.004812 |
0.031 |
0.014 |
0.070016 |
|
2016 |
17.046602 |
0.002371 |
0.031 |
0.014 |
0.002458 |
|
2017 |
17.655159 |
0.002371 |
0.031 |
0.014 |
0.005098 |
|
2018 |
18.285442 |
0.002371 |
0.031 |
0.014 |
0.007929 |
|
2025 |
23.374494 |
0.000000 |
0.031 |
0.014 |
0.000000 |
|
2050 |
56.180777 |
0.000000 |
0.031 |
0.014 |
0.000000 |
|
2100 |
324.547893 |
0.000000 |
0.031 |
0.014 |
0.000000 |
Table 3c.
The items in Table 3 are identified in The Legend (Table 1), nevertheless a word or two in explanation may be useful here. The trade deficit, D, equals the negative of the trade surplus, S; thus, we have trade surpluses subsequent to 2015. Gross Domestic Consumption, GDC, equals GDP plus imports minus exports. GDC means consumption of goods and services – not money, even though it is measured in monetary units. The computation of the values of rd shaded in light green was discussed above. The values of rp and re were taken from the Reference Case in the DOE’s AEO2005 Table A2. They are held constant throughout this exercise. The spreadsheet name for W minus V is delta, which measures the repatriated imports. After 2018, W equals V since rd is set to zero, therefore delta equals zero. (See legend.) The use of the variable E1 was not a good idea, probably. However, it obscures subsequent computations only slightly.
|
Year |
P0 |
E0 |
E1 |
(Eo/Po)d |
r1 |
|
2003 |
|
|
|
|
|
|
2004 |
|
|
|
|
|
|
2005 |
10.381 |
98.220 |
101.009 |
9.462 |
0.004077 |
|
2006 |
11.045 |
101.009 |
102.433 |
9.145 |
0.004077 |
|
2007 |
11.045 |
101.009 |
103.877 |
9.145 |
0.004077 |
|
2008 |
11.045 |
101.009 |
105.342 |
9.145 |
0.004077 |
|
2009 |
11.045 |
101.009 |
106.827 |
9.145 |
0.004077 |
|
2010 |
11.045 |
101.009 |
108.333 |
9.145 |
0.004077 |
|
2011 |
11.045 |
101.009 |
109.860 |
9.145 |
0.004077 |
|
2012 |
11.045 |
101.009 |
111.409 |
9.145 |
0.004077 |
|
2013 |
11.045 |
101.009 |
112.980 |
9.145 |
0.004077 |
|
2014 |
11.045 |
101.009 |
114.573 |
9.145 |
0.004077 |
|
2015 |
11.045 |
101.009 |
116.188 |
9.145 |
0.004077 |
|
2016 |
16.459 |
126.990 |
128.780 |
7.716 |
0.004077 |
|
2017 |
16.459 |
126.990 |
130.596 |
7.716 |
0.004077 |
|
2018 |
16.459 |
126.990 |
132.437 |
7.716 |
0.004077 |
|
2025 |
18.416 |
146.730 |
161.838 |
7.968 |
0.004077 |
|
2050 |
18.416 |
146.730 |
229.659 |
7.968 |
0.004077 |
|
2100 |
18.416 |
146.730 |
462.476 |
7.968 |
0.004077 |
Table 3d.
The variable (Eo/Po)d is the initial value of the domestic energy over GDP ratio for each period of interest. The variable r1, which represents the effect of Apollo-type programs upon the GDP, is computed to ten-decimal-place accuracy even though only the first significant figure is meaningful. This was done to make arithmetic error more obvious should it occur. The variable rP, where the subscript is a capital P, is the sum rp + r1 + rd. P is the GDP. The spreadsheet name for Φ is phi, the ratio of foreign to domestic energy per dollar ratio; that is, Φ is the ratio of two ratios.
The spreadsheet name for [1 + Φ(W-V)] is bracket. The variable ao is the fraction of the energy budget not charged to transportation. The rate ra at which conservation measures are incorporated into all sectors save transportation is equal to the natural logarithm of 0.8, the fraction to which energy use has been reduced in these sectors, divided by ten, the number of years required to establish the total and final extent of all such conservation measures. Clearly, much greater savings could be effected by living underground (for one example) or building homes with four foot thick earthen walls (for another), but Americans do not seem likely to break with middle-class traditions until they are forced from their middle-class homes. See The Legend (Table 1) for the meaning of A, bo, rb, B, and k.
The quantity r2 is the contribution to the rate of increase of energy demand that is due to the activities advocated by the Apollo Alliance. The condition that the GDP increase by 1.4 TUSD is sufficient to establish the value of E in 2015. The value of r2 that results in precisely that increase over the ten-year period is obtained by trial and error or, more properly, by the method of bisection, which amounts to an orderly approach to trial and error. The energy demand from all sectors except the transportation sector, Ea, is obtained by multiplying E/k by A. Similarly for Eb. These items might be of interest to some analysts. Between 2005 and 2015, the total energy demand is obtained from their sum. After 2015, the calculation is re-initialized with a new value of Eo such that the new value of E (new E) is equal to E/k since k equals one. Finally, in Table 3h, E/GDP, the new ratio of energy over GDP, is computed and tabulated.
|
Year |
r_P |
P |
phi |
bracket |
ao |
|
2003 |
|
|
|
|
|
|
2004 |
|
|
|
|
|
|
2005 |
0.039890 |
11.044993 |
1.689158 |
1.000000 |
0.722700 |
|
2006 |
0.039890 |
11.494479 |
1.747577 |
1.008731 |
0.722700 |
|
2007 |
0.039890 |
11.962258 |
1.747577 |
1.018130 |
0.722700 |
|
2008 |
0.039890 |
12.449073 |
1.747577 |
1.028234 |
0.722700 |
|
2009 |
0.039890 |
12.955700 |
1.747577 |
1.039083 |
0.722700 |
|
2010 |
0.039890 |
13.482944 |
1.747577 |
1.050720 |
0.722700 |
|
2011 |
0.039890 |
14.031645 |
1.747577 |
1.063189 |
0.722700 |
|
2012 |
0.039890 |
14.602675 |
1.747577 |
1.076538 |
0.722700 |
|
2013 |
0.039890 |
15.196945 |
1.747577 |
1.090814 |
0.722700 |
|
2014 |
0.039890 |
15.815399 |
1.747577 |
1.106070 |
0.722700 |
|
2015 |
0.039890 |
16.459021 |
1.747577 |
1.122359 |
0.722700 |
|
2016 |
0.037448 |
17.087059 |
2.071412 |
1.005092 |
0.806574 |
|
2017 |
0.037448 |
17.739061 |
2.071412 |
1.010559 |
0.806574 |
|
2018 |
0.037448 |
18.415943 |
2.071412 |
1.016424 |
0.806574 |
|
2025 |
0.035077 |
23.541314 |
2.005884 |
1.000000 |
0.806574 |
|
2050 |
0.035077 |
56.581731 |
2.005884 |
1.000000 |
0.806574 |
|
2100 |
0.035077 |
326.864144 |
2.005884 |
1.000000 |
0.806574 |
Table 3e.
|
Year |
ra |
A |
bo |
rb |
B |
|
2003 |
|
|
|
|
|
|
2004 |
|
|
|
|
|
|
2005 |
-0.02231 |
0.722700 |
0.277300 |
-0.06931 |
0.277300 |
|
2006 |
-0.02231 |
0.706752 |
0.277300 |
-0.06931 |
0.258730 |
|
2007 |
-0.02231 |
0.691156 |
0.277300 |
-0.06931 |
0.241404 |
|
2008 |
-0.02231 |
0.675904 |
0.277300 |
-0.06931 |
0.225238 |
|
2009 |
-0.02231 |
0.660989 |
0.277300 |
-0.06931 |
0.210154 |
|
2010 |
-0.02231 |
0.646403 |
0.277300 |
-0.06931 |
0.196081 |
|
2011 |
-0.02231 |
0.632138 |
0.277300 |
-0.06931 |
0.182950 |
|
2012 |
-0.02231 |
0.618189 |
0.277300 |
-0.06931 |
0.170698 |
|
2013 |
-0.02231 |
0.604547 |
0.277300 |
-0.06931 |
0.159267 |
|
2014 |
-0.02231 |
0.591206 |
0.277300 |
-0.06931 |
0.148601 |
|
2015 |
-0.02231 |
0.578160 |
0.277300 |
-0.06931 |
0.138650 |
|
2016 |
|
0.645259 |
0.193426 |
|
0.096713 |
|
2017 |
|
0.645259 |
0.193426 |
|
0.096713 |
|
2018 |
|
0.645259 |
0.193426 |
|
0.096713 |
|
2025 |
|
0.645259 |
0.193426 |
|
0.096713 |
|
2050 |
|
0.645259 |
0.193426 |
|
0.096713 |
|
2100 |
|
0.645259 |
0.193426 |
|
0.096713 |
Table 3f.
|
Year |
k = A+B |
r2 |
E/k |
Ea |
Eb |
|
2003 |
|
|
|
|
|
|
2004 |
|
|
|
|
|
|
2005 |
1.000000 |
0.030641 |
101.009 |
72.999 |
28.010 |
|
2006 |
0.965482 |
0.030641 |
106.543 |
75.299 |
27.566 |
|
2007 |
0.932560 |
0.030641 |
112.444 |
77.717 |
27.144 |
|
2008 |
0.901142 |
0.030641 |
118.745 |
80.260 |
26.746 |
|
2009 |
0.871143 |
0.030641 |
125.476 |
82.938 |
26.369 |
|
2010 |
0.842483 |
0.030641 |
132.673 |
85.760 |
26.015 |
|
2011 |
0.815088 |
0.030641 |
140.377 |
88.737 |
25.682 |
|
2012 |
0.788887 |
0.030641 |
148.628 |
91.880 |
25.371 |
|
2013 |
0.763814 |
0.030641 |
157.474 |
95.200 |
25.080 |
|
2014 |
0.739808 |
0.030641 |
166.966 |
98.711 |
24.811 |
|
2015 |
0.716810 |
0.030641 |
177.160 |
102.427 |
24.563 |
|
2016 |
1.000000 |
0.028733 |
133.209 |
|
|
|
2017 |
1.000000 |
0.028733 |
139.781 |
|
|
|
2018 |
1.000000 |
0.028733 |
146.730 |
|
|
|
2025 |
1.000000 |
0.024889 |
192.639 |
|
|
|
2050 |
1.000000 |
0.024889 |
509.303 |
|
|
|
2100 |
1.000000 |
0.024889 |
3559.912 |
|
|
Table 3g.
|
Year |
new E |
E/GDP |
coal |
oil |
gas |
|
2003 |
98.220 |
9.462 |
22.660 |
12.030 |
19.580 |
|
2004 |
|
|
21.388 |
|
|
|
2005 |
101.009 |
9.145 |
20.188 |
11.436 |
19.861 |
|
2006 |
102.865 |
8.949 |
19.055 |
11.151 |
20.004 |
|
2007 |
104.861 |
8.766 |
17.985 |
10.872 |
20.147 |
|
2008 |
107.006 |
8.595 |
16.976 |
10.601 |
20.291 |
|
2009 |
109.307 |
8.437 |
16.023 |
10.336 |
20.436 |
|
2010 |
111.775 |
8.290 |
15.124 |
10.077 |
20.583 |
|
2011 |
114.419 |
8.154 |
14.275 |
9.826 |
20.730 |
|
2012 |
117.251 |
8.029 |
13.474 |
9.580 |
20.878 |
|
2013 |
120.281 |
7.915 |
12.717 |
9.341 |
21.028 |
|
2014 |
123.523 |
7.810 |
12.004 |
9.108 |
21.178 |
|
2015 |
126.990 |
7.716 |
11.330 |
8.880 |
21.330 |
|
2016 |
133.209 |
7.796 |
11.490 |
8.658 |
21.483 |
|
2017 |
139.781 |
7.880 |
11.652 |
8.442 |
21.637 |
|
2018 |
146.730 |
7.968 |
11.816 |
8.231 |
21.791 |
|
2025 |
192.639 |
8.183 |
13.033 |
6.895 |
22.907 |
|
2050 |
509.303 |
9.001 |
18.494 |
3.663 |
27.380 |
|
2100 |
3559.912 |
10.891 |
37.243 |
1.034 |
6.109 |
Table 3h.
Tables 3h and 3i contains the components of the energy supply except for the extraordinary quantity of nuclear energy over and above the quantity anticipated by the DOE that is required to balance the energy budget. I have assumed that, in partial defense against climate change, the domestic production of coal will be reduced to one half of its 2003 value by 2015, after which carbon sequestration techniques will have advanced sufficiently that coal production can resume modest growth at the rate of 1.4% per year as predicted by the DOE in Table A1 of the AEO2005 Reference Case Forecast. Domestic production of petroleum (oil) is assumed to be diminishing at the rate of 2.53% per annum. This is the average rate at which US production has diminished between 1987 and 2002. Natural gas production (gas) is assumed to increase according to DOE predictions until 2050, which, in this study, is taken to be the latest date at which Peak Gas is likely to be reached. Between 2050 and 2100, we expect a rapid drop-off of gas production at a yearly rate of 3%. It seems reasonable to assume that natural gas plant liquids (NGPL) will move roughly in parallel with natural gas production albeit with more robust growth according to the DOE. Subsequent to Peak Gas, NGPL production is assumed to diminish at a yearly rate of 3% as well. Inasmuch as the Apollo Alliance has focused to a great extent upon the rapid introduction of renewable energy (renewables), I have assumed that, during the initial ten-year period 2005-2015, somehow the resources will be found to achieve Maximum Renewables, which according to Pimentel et al. (Pimentel.pdf) amounts to no more than 45.7 emquads/year. Subsequently, despite the Pimentel et al. prediction, it seems reasonable that slow growth of renewables is likely given the intellectual capital that is certain to be expended upon this worthy goal. Maximum Renewables was discussed earlier under Assumptions.
Year |
NGPL |
renewables |
other |
DOE nuclear |
E I |
|
2003 |
2.340 |
5.890 |
0.930 |
7.970 |
30.950 |
|
2004 |
2.366 |
6.987 |
0.916 |
8.001 |
31.765 |
|
2005 |
2.392 |
8.287 |
0.903 |
8.031 |
32.602 |
|
2006 |
2.418 |
9.830 |
0.890 |
8.062 |
30.576 |
|
2007 |
2.445 |
11.660 |
0.877 |
8.093 |
28.351 |
|
2008 |
2.472 |
13.831 |
0.864 |
8.124 |
25.915 |
|
2009 |
2.500 |
16.406 |
0.852 |
8.155 |
23.253 |
|
2010 |
2.527 |
19.461 |
0.839 |
8.186 |
20.354 |
|
2011 |
2.555 |
23.084 |
0.827 |
8.218 |
17.202 |
|
2012 |
2.583 |
27.382 |
0.815 |
8.249 |
13.783 |
|
2013 |
2.612 |
32.480 |
0.803 |
8.281 |
10.081 |
|
2014 |
2.641 |
38.527 |
0.792 |
8.313 |
6.080 |
|
2015 |
2.670 |
45.700 |
0.780 |
8.345 |
1.761 |
|
2016 |
2.700 |
45.746 |
0.769 |
8.377 |
1.215 |
|
2017 |
2.729 |
45.792 |
0.757 |
8.409 |
0.629 |
|
2018 |
2.760 |
45.837 |
0.746 |
8.441 |
0.000 |
|
2025 |
2.980 |
46.159 |
0.674 |
8.670 |
0.000 |
|
2050 |
3.923 |
47.328 |
0.467 |
9.540 |
0.000 |
|
2100 |
0.875 |
49.754 |
0.224 |
11.552 |
0.000 |
Table 3i.
The spreadsheet name other has been given to the small and very likely diminishing contributions expected from hydroelectric, alcohol from biomass, firewood, and unidentified contributions to energy production. Hydroelectric power is limited by the accumulation of silt behind power dams and putative environmental damage such as the disruption of the migration of fresh-water fish associated with spawning. Biomass is limited by energy returns on energy invested [Pimentel] and competition for land and water resources with agriculture. A certain amount of junk timber will be harvested for biomass especially firewood, however the contribution from all sources in this category is not significant despite my 1997 predictions to the contrary. By ‘DOE nuclear’ is meant the growth of nuclear power installations predicted by the DOE without acknowledging Peak Oil.
Currently, the United States imports a large portion of its energy needs – principally in the form of crude oil. A stated goal of the Apollo Alliance and others is to eliminate US dependence on foreign energy. This is not a particularly neighborly way of stating the case. The reader knows that true wealth is energy (corrected for conservation and intelligent use – or, more properly, corrected for wasteful and frivolous use). That is, if we assume equally efficient and intelligent use of energy by all consumers, a nation’s standard of living can be measured by the energy consumed per capita. Therefore, when we purchase energy from a trading partner at an emquad per dollar ratio in excess of our domestic energy to GDP ratio, we more or less impoverish that trading partner, which is hardly neighborly. If we abandon this practice in an orderly manner, we are complying with the Fundamental Principle of Neighborliness to the extent that wealth no longer flows away from our neighbor and toward ourselves. When wealth flows always from those whose per capita energy consumption is greater toward those whose per capita energy consumption is less, we are in complete compliance. Let us make this definite by supplying a few numbers. In 2003, per capita energy consumption for the United States was 11.326 kW per capita while E/GDP was 9.46 emquads/TUSD (Table 3d). The comparable figures for Saudi Arabia were about 6.218 kW per capita and 17.08 emquads/TUSD. When we purchase oil for $50 per barrel, this amounts to a flow of 115.435 emquads/TUSD. For each emquad they sell us, they can purchase only 0.082 emquads worth of American goods. Moreover, if they had consumed their entire energy production, their standard of living would have been 26.143 kW/cap, which is 231% of our standard of living, instead of 6.218 kW/cap, which is about 55% of ours. Is it any wonder that some people are angry with us?
The foregoing paragraph explains why it is politically correct, by which I mean truly correct policy, to phase out energy imports (EI) in an orderly fashion, namely, in exactly the same proportion as trade imports (goods and services) are phased out according to the second to last column in Table 3a. Moreover, since another stated goal of the Apollo Alliance is to make American goods and services attractive to other nations, I have increased the export of energy (EX) in proportion to the other exports – regardless of whether or not energy exports (and imports) are included in the trade balance as shown in Table 3a and 3b, as discussed in the Disclaimer (above). ED is the energy trade deficit, which in the case of negative numbers represents a surplus.
|
Year |
E X |
E D |
E demand |
E supply |
E deficit |
|
2003 |
3.950 |
27.000 |
98.220 |
98.220 |
0.000 |
|
2004 |
3.942 |
27.823 |
|
|
|
|
2005 |
3.934 |
28.668 |
101.009 |
99.767 |
1.242 |
|
2006 |
3.791 |
26.786 |
102.865 |
98.196 |
4.669 |
|
2007 |
3.633 |
24.719 |
104.861 |
96.799 |
8.063 |
|
2008 |
3.460 |
22.455 |
107.006 |
95.614 |
11.392 |
|
2009 |
3.272 |
19.982 |
109.307 |
94.690 |
14.618 |
|
2010 |
3.067 |
17.287 |
111.775 |
94.085 |
17.690 |
|
2011 |
2.845 |
14.358 |
114.419 |
93.873 |
20.546 |
|
2012 |
2.604 |
11.180 |
117.251 |
94.142 |
23.109 |
|
2013 |
2.344 |
7.738 |
120.281 |
95.000 |
25.281 |
|
2014 |
2.063 |
4.017 |
123.523 |
96.578 |
26.944 |
|
2015 |
1.761 |
0.000 |
126.990 |
99.035 |
27.955 |
|
2016 |
1.437 |
-0.222 |
133.209 |
98.999 |
34.209 |
|
2017 |
1.088 |
-0.460 |
139.781 |
98.957 |
40.823 |
|
2018 |
0.715 |
-0.715 |
146.730 |
98.908 |
47.823 |
|
2025 |
0.914 |
-0.914 |
192.639 |
100.404 |
92.235 |
|
2050 |
2.197 |
-2.197 |
509.303 |
108.598 |
400.704 |
|
2100 |
12.691 |
-12.691 |
3559.912 |
94.101 |
3465.811 |
Table 3j.
The column labeled E demand (energy demand) is an exact copy of the column in Table 3d labeled new E. E supply is the algebraic sum of the items in Table 3e. E deficit is E demand minus E supply. The demand for electricity (elec demand) is simply 40% of the total demand, which is about right in 2005. Many analysts believe that, with further advances in the information/communication economy, future demand for electricity will constitute a larger proportion of our energy budget. Indeed, this increase has already begun; however, I cannot let this opportunity pass without mentioning that much of the electrical use in computers, cell phones, etc. is frivolous; and, of the portion that is not frivolous, one may argue that almost all of that is concerned, not with creating more wealth, but with acquiring as much of the wealth that has been created by others for oneself or for one’s masters – although the waste of electricity for communication and information is not quite so catastrophic as the waste of fuels for transportation and devastation. Nevertheless, I must agree that the enjoyment of good music and other fine art electronically is not frivolous although it would be better if it could be enjoyed without the interference of electronics. In any case, I have left the proportion of total demand assigned to electricity constant at 40% throughout this exercise, which seemed to require some justification.
The next column (elecNMbR) represents that portion of the electrical demand that is not met by renewables, which, according to the Apollo Alliance, is our first choice for electrical production even in a capitalist setting. The total energy from nuclear power plants (total nuc.) is the sum of the DOE nuclear from Table 3e and the energy deficit (E deficit) since we agreed to make up any shortfall with nuclear power. In fact, there is really no choice. This will be discussed below under Conclusions. From 2005 to 2009, nuclear electricity (nuclear e) amounts to all of the nuclear power produced. After 2009, all of the electrical demand not met by renewables (elecNMbR) will be met by nuclear. The remaining nuclear power will be used to split water to produce hydrogen directly without an intermediate electrical step. This will be described after Table 3g.
The area in square miles that is likely to be devoted to nuclear plant sites per emquad of yearly energy production (A/equad) is calculated as follows:
![]()
where 0.8 is the assumed capacity factor, 2.98 emquads/quad is the transformity (in the sense of Odum), and eNPI stands for electrical nuclear power installation. Finally, for electrical nuclear power installations:
![]()
or
![]()
from which the area in square miles required for nuclear power electrical plants (area_e) in Table 3g (below) is computed.
|
Year |
elec demand |
elecNMbR |
total nuc. |
nuclear_e |
A/equad |
|
2003 |
|
|
|
|
|
|
2004 |
|
|
|
|
|
|
2005 |
40.404 |
32.116 |
9.273 |
9.273 |
6.600 |
|
2006 |
41.146 |
31.316 |
12.731 |
12.731 |
6.600 |
|
2007 |
41.944 |
30.284 |
16.156 |
16.156 |
6.600 |
|
2008 |
42.802 |
28.971 |
19.516 |
19.516 |
6.600 |
|
2009 |
43.723 |
27.316 |
22.773 |
22.773 |
6.600 |
|
2010 |
44.710 |
25.249 |
25.876 |
25.249 |
6.600 |
|
2011 |
45.768 |
22.683 |
28.764 |
22.683 |
6.600 |
|
2012 |
46.900 |
19.518 |
31.358 |
19.518 |
6.600 |
|
2013 |
48.112 |
15.632 |
33.562 |
15.632 |
6.600 |
|
2014 |
49.409 |
10.882 |
35.257 |
10.882 |
6.600 |
|
2015 |
50.796 |
5.096 |
36.300 |
5.096 |
6.600 |
|
2016 |
53.284 |
7.538 |
42.586 |
7.538 |
6.600 |
|
2017 |
55.912 |
10.121 |
49.232 |
10.121 |
6.600 |
|
2018 |
58.692 |
12.855 |
56.263 |
12.855 |
6.600 |
|
2025 |
77.056 |
30.896 |
100.905 |
30.896 |
6.600 |
|
2050 |
203.721 |
156.393 |
410.245 |
156.393 |
6.600 |
|
2100 |
1423.965 |
1374.211 |
3477.363 |
1374.211 |
6.600 |
Table 3k.
The remainder of the nuclear power required to close the energy balance (nuclear_H) is assumed to be devoted to thermal splitting of water to produce hydrogen. This overcomes the deficiency of the hydrogen economy that would have been introduced had there been an intermediate electrical step. (See http://web.gat.com/pubs-ext/MISCONF03/A24265.pdf .) The area in square miles required to produce one emquad of hydrogen (A/Hquad) is computed as follows:
![]()
![]()
where 1 HNPI is a nuclear power plant of the same capacity as a 1000 MW electrical power plant except that it produces hydrogen directly as described in the hyperlink, 1 TWthermal is an amount of power generated by nuclear fission equivalent to 1 TW from coal, 0.8 is the capacity factor, the efficiency of 0.5 is suggested by the hyperlink, and 1 Hquad is an emquad from hydrogen. I have some doubts as to the validity of these numbers, however I am trying to place the best possible defense before a jury that will sit in judgment concerning the efficacy of nuclear hydrogen. (An alternative expression leads to nearly five times the area per emquad for hydrogen from nuclear power.)
Let us complete the computation of A/Hquad as follows:
![]()
or
![]()
from which the area in square miles required for nuclear power hydrogen plants (area_H) in Table 3g is computed. The total area (tot. area) is the sum of the two areas, and the number of nuclear power installations (NPI) , each equivalent (with respect to the rate at which matter is converted to energy according to Einstein’s formula) to a 1000 MWe nuclear power installation, is easily computed from the total area devoted to such plants each of which is assumed to occupy 300 acres. This is a conservative number. I have not charged the plants with the pro rata share of the space that must be devoted to mining, the preparation of fuel rods, the fabrication of plant equipment, transportation equipment, pipelining, and the fabrication of pipelines whether they be used to transport hydrogen or conduct electricity. It might be reasonable to pipeline hydrogen in the annular area surrounding ‘high-temperature’, super-conducting electrical conduits whereby thermal losses due to heat transfer might be compensated for by eliminating the significant i2R losses normally associated with the conduction of electricity. It is worth noting that the economic, social, and real-estate burden of transporting electricity and hydrogen is considerable – and perhaps unbearable.
|
Year |
area_e |
nuclear_H |
A/Hquad |
area_H |
tot. area |
|
2003 |
|
|
|
|
|
|
2004 |
|
|
|
|
|
|
2005 |
61.20 |
0.00 |
13.20 |
0.00 |
61.20 |
|
2006 |
84.03 |
0.00 |
13.20 |
0.00 |
84.03 |
|
2007 |
106.63 |
0.00 |
13.20 |
0.00 |
106.63 |
|
2008 |
128.80 |
0.00 |
13.20 |
0.00 |
128.80 |
|
2009 |
150.30 |
0.00 |
13.20 |
0.00 |
150.30 |
|
2010 |
166.64 |
0.63 |
13.20 |
8.28 |
174.93 |
|
2011 |
149.71 |
6.08 |
13.20 |
80.27 |
229.98 |
|
2012 |
128.82 |
11.84 |
13.20 |
156.29 |
285.11 |
|
2013 |
103.17 |
17.93 |
13.20 |
236.67 |
339.84 |
|
2014 |
71.82 |
24.38 |
13.20 |
321.75 |
393.57 |
|
2015 |
33.63 |
31.20 |
13.20 |
411.89 |
445.52 |
|
2016 |
49.75 |
35.05 |
13.20 |
462.64 |
512.39 |
|
2017 |
66.80 |
39.11 |
13.20 |
516.27 |
583.07 |
|
2018 |
84.84 |
43.41 |
13.20 |
573.00 |
657.84 |
|
2025 |
203.92 |
70.01 |
13.20 |
924.11 |
1128.03 |
|
2050 |
1032.19 |
253.85 |
13.20 |
3350.84 |
4383.03 |
|
2100 |
9069.79 |
2103.15 |
13.20 |
27761.61 |
36831.40 |
Table 3l.
The row for the year 2100, in this last column, shaded in yellow, is the bottom line for this calculation as I shall postpone the analysis of water use for a subsequent installment to this program whereby the impact of politics upon the Twenty-First Century has begun to be studied. Our final result is that more than 78 thousand large nuclear power installations will need to be constructed during this century for the United States alone if the modest growth in standard of living predicted by this program of conservation within capitalism is sustained throughout this century. The ramifications of this will be discussed below under Conclusions. The remainder of this spreadsheet concerns the computation of the value of r2, the contribution to the exponential rate of increase of energy use in the United States due to activities such as those advocated in the Apollo Alliance Ten-Point Plan.
The Gross Domestic Consumption (GDC), which is the GDP plus imports minus exports in TUSD, is computed next followed by the all-important DOE estimate for the population of the United States in billions of people or gigacaps (pop in Gcap). We could have availed ourselves of the extremely useful estimates prepared by the US Census Bureau, International Population Center at http://www.census.gov/ipc/www/idbnew.html . For simplicity, I have chosen to employ throughout the Twenty-First Century the DOE estimate of 0.8% increase per year.
|
Year |
NPI |
GDCon |
pop in Gcap |
Econsumed |
k |
|
2003 |
|
|
0.291390 |
110.800 |
|
|
2004 |
|
|
|
|
|
|
2005 |
130.57 |
11.59 |
0.30 |
114.621 |
1.00000 |
|
2006 |
179.26 |
12.00 |
0.30 |
115.862 |
0.96548 |
|
2007 |
227.47 |
12.43 |
0.30 |
117.150 |
0.93256 |
|
2008 |
274.78 |
12.88 |
0.30 |
118.487 |
0.90114 |
|
2009 |
320.64 |
13.34 |
0.31 |
119.879 |
0.87114 |
|
2010 |
373.17 |
13.81 |
0.31 |
121.329 |
0.84248 |
|
2011 |
490.62 |
14.30 |
0.31 |
122.842 |
0.81509 |
|
2012 |
608.23 |
14.82 |
0.31 |
124.424 |
0.78889 |
|
2013 |
725.00 |
15.34 |
0.32 |
126.081 |
0.76381 |
|
2014 |
839.62 |
15.89 |
0.32 |
127.819 |
0.73981 |
|
2015 |
950.45 |
16.46 |
0.32 |
129.647 |
0.71681 |
|
2016 |
1093.09 |
17.05 |
0.32 |
134.709 |
1.000 |
|
2017 |
1243.87 |
17.66 |
0.33 |
140.049 |
1.000 |
|
2018 |
1403.38 |
18.29 |
0.33 |
145.690 |
1.000 |
|
2025 |
2406.46 |
23.37 |
0.35 |
191.274 |
1.000 |
|
2050 |
9350.47 |
56.18 |
0.42 |
505.693 |
1.000 |
|
2100 |
78573.66 |
324.55 |
0.63 |
3534.686 |
1.000 |
Table 3m.
Year |
Ec std. liv. |
Ec/Gcap |
Estdliv/Gcap |
r_n_hat |
Ec std livsum |
Ec,std.liv e^rn,hat |
|
2003 |
|
380.247 |
|
|
|
|
|
2004 |
|
|
|
|
|
|
|
2005 |
87.876 |
387.116 |
296.788 |
|
|
|
|
2006 |
90.963 |
388.189 |
304.765 |
|
|
|
|
2007 |
94.234 |
389.375 |
313.211 |
|
|
|
|
2008 |
97.709 |
390.683 |
322.173 |
|
|
|
|
2009 |
101.406 |
392.122 |
331.699 |
|
|
|
|
2010 |
105.347 |
393.702 |
341.844 |
|
|
|
|
2011 |
109.556 |
395.436 |
352.670 |
|
|
|
|
2012 |
114.060 |
397.338 |
364.241 |
|
|
|
|
2013 |
118.887 |
399.421 |
376.632 |
|
|
|
|
2014 |
124.071 |
401.702 |
389.922 |
|
|
|
|
2015 |
129.647 |
404.200 |
404.200 |
|
|
129.647 |
|
2016 |
134.709 |
416.634 |
416.634 |
0.038889 |
134.709 |
134.788 |
|
2017 |
140.049 |
429.700 |
429.700 |
0.038889 |
140.049 |
140.133 |
|
2018 |
145.690 |
443.446 |
443.446 |
0.038889 |
145.690 |
145.690 |
|
2025 |
191.274 |
550.485 |
550.485 |
0.038889 |
191.274 |
191.274 |
|
2050 |
505.693 |
1191.566 |
1191.566 |
0.038889 |
505.693 |
505.693 |
|
2100 |
3534.686 |
5582.949 |
5582.949 |
0.038889 |
3534.686 |
3534.686 |
Table 3n.
Energy consumption (Econsumed) is computed as follows:
![]()
where αtp is the weighted average of the E over GDP ratio in 2003 for our fifteen most active trading partners (which does not include Saudi Arabia) – assumed to remain constant throughout the Twenty-First Century for the reasons elaborated above, I and X stand for imports and exports, E is the energy demand (E demand) computed on this spreadsheet, and P is the GDP. Perhaps it should have been noted previously that the energy demand term, E, can be written as follows:
![]()
which, when substituted in the equation for energy consumption, illustrates the relationship between the energy trade and trade in goods and services:
![]()
where EI and EX (resp.) might have been included in αtpI and (E/P)X (resp.). This difficulty was discussed in the Disclaimer (above). In any case, the discrepancy is no greater than other uncertainties in the trade data. The trade data used on this spreadsheet (obtained, in part, from the CIA Factbook) do not seem to include the trade in primary energy despite claims to the contrary by a spokesman for the Bureau of Economic Analysis. My particular reason for displaying this equation is that it was used to justify the proportionality between the energy trade terms and the overall trade balance.
The variable k has been transcribed from Table 3d in order to adjust the energy consumed (Econsumed) to account for standard of living. If cars, for example got 50 miles per gallon instead of 25 miles per gallon, one could enjoy the same trip in 2015 for one half of the energy expended in 2005. This would not affect the standard of living. Therefore, to compute Ec std. liv., the correct value of energy to employ in the standard of living ratio (Estd.liv./Gcap), for the years 2005 to 2015, we should divide out the value of k that was used to compute E demand and multiply by 0.71681, the value of k in 2015, by which time substantial and politically feasible conservation measures can be assumed to be in place. There is no reason to assume that our trading partners, who use much less energy per capita than we do, will effect similar changes; therefore, the αtpI term is not adjusted. However, our exports should be adjusted by the same ratio as we have applied to energy demand.
Subsequent to 2015, energy demand (E demand) has been calculated on this spreadsheet by adjusting r2 to match the value of Ec,std.liv the energy consumed corrected for conservation computed in two ways: (i) Ec,std.livsum, by summing the energy associated with the GDP and the energy associated with imports and exports, and (ii) Ec,std.liv e^rn,hat, computed directly from rn,hat by matching the exponential growth in the standard of living ratio (Estd.liv./Gcap) between 2005 and 2015. We should expect to match intermediate values of Ec,std.liv only approximately because the sum of exponential functions of different arguments is not equal to the exponential function of the sum of the arguments; however, the agreement between the intermediate values is good enough. (Please remember that, according to Taylor’s Theorem, exp(arg) approximately equals 1 + arg for small arguments such that arg2 << arg.)
The value that we use for rn,hat is of paramount importance. A variation of 0.001 can result in a change in the prediction for the number of nuclear power installations amounting to hundreds if not thousands of NPIs. Of course, to an anti-nuke Green Party member, only 50,000 NPIs as opposed to 75,000 NPIs will not be exceedingly comforting. The exponent rn,hat was obtained in this exercise by insisting that improvements in the standard of living ratio (Estd.liv/Gcap) be sustained throughout the Twenty-First Century. This is both fair and unfair. It is fair because workers may have been led to believe that improvements in their well-being, i.e., standards of living, will continue indefinitely; moreover, parents may have assured their children, as I was assured by my parents, that, provided they work hard and excel in their studies, they, the children, will enjoy more affluence than their parents have enjoyed. It is unfair because, due to the very rapid deployment of energy conservation measures assumed in this study, the improvement in the average standard of living has been rather brisk; i.e., in excess of 3% per annum. If, for example, I had introduced the identical savings over a twenty year period, the expected rate of increase would have resulted in a somewhat more manageable energy budget in 2100. The average person, after all, is not likely to correct his standard of living for conservation or the lack of it. For that matter, he is not likely to correct his standard of living for the intelligent use of resources or the lack of it. (One man can walk two blocks from his home and listen to the Modern Jazz Quartet and the Academy of St Martin-in-the-Fields Chamber Orchestra at no cost over the space of a long day while a second man drives 20 miles and pays $50 to hear Elvis Presley and 20 miles further to pay $50 to hear Britney Spears during the same period of time. Which man is enjoying the higher standard of living?)
Finally, we should examine the capital costs and the energetic costs of installing so very many nuclear power installations. For electrical facilities, we have
![]()
and, for hydrogen facilities, we have
![]()
![]()
where I might have divided by 0.5 to reflect the 50% efficiency if I were not trying to make the best possible case for hydrogen from nuclear. Instead, I have assumed that, by one kWthermal, Shultz et al. mean one kilowatt (of heat) obtained from combustion of hydrogen as opposed to one kilowatt (of heat) from the nuclear reaction. These numbers are entered in Table 3.
|
dE_nuc |
3067.1 |
dE nuc. elec |
1217.817 |
dE nuc. H2 |
1849.3 |
|
Cap cost |
79.028 |
CC nuc. e. |
25.746 |
CC nuc. H2 |
53.3 |
|
CC / Po |
1.397 |
CC*(E/P)/Eo |
1.690 |
TUSD/equad |
0.021 |
|
integral |
136.181 |
integral |
154.023 |
TUSD/Hquad |
0.029 |
|
RHS |
134.784 |
RHS |
152.333 |
|
|
|
r_n |
0.000323 |
r_n_cup |
0.000338 |
|
|
|
discrepancy |
0 |
discrepancy |
2.49E-07 |
|
|
|
LHS |
134.784 |
LHS |
152.333 |
|
|
Table 3. Computations for capital costs and energy costs of nuclear power
The capital costs for nuclear electricity (CC nuc. e) and nuclear hydrogen (CC nuc. H2) (resp.) are obtained by multiplying the increase in energy production in emquads from electric NPIs (dE nuc. elec) and hydrogen NPIs (dE nuc. H2) (resp.) by 0.02114 TUSD/equad and 0.028812 TUSD/Hquad (resp.). I wish to determine to what extent the total capital cost (Cap cost), obtained by summing the capital costs of eNPIs and HNPIs, has influenced the rate of increase in the GDP, r1, due to the activities advocated by the Apollo Alliance; therefore, I shall determine by how much r1 can be reduced if the capital cost had not been spent. This quantity, rn, can best be understood with the diagram in Figure 4 where letters preceded by underbars stand for subscripts.
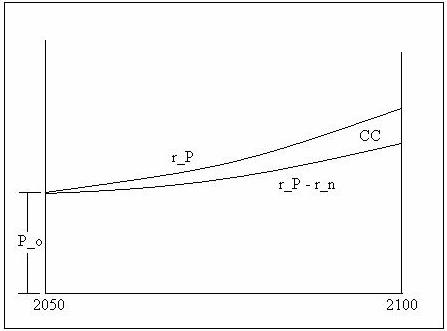
Figure 4. Diagram for capital costs of nuclear power
The area between the two exponential curves in Figure 4 represents the capital cost, abbreviated CC.
![]()
![]()

which, since

can be written as
![]()
or
![]()
The integral minus CC/Po on the right-hand side (RHS) can be computed directly, whereas rn (r_n) can be adjusted by trial and error (or the method of bisection) until the LHS, which depends upon rn in a nonlinear fashion, matches the RHS sufficiently closely that the discrepancy (RHS – LHS) is negligible. One sees that the value obtained for rn = 0.0003228729350 is an order of magnitude less than r1 = 0.004077169. Thus, regardless of the effect upon markets, taxes, taxpayers, and politicians of expenditures of nearly 80 trillion US dollars, a society with the will to accomplish the goal of a hydrogen economy can easily absorb such an expenditure unless deterred by other factors such as the availability of plant sites and so on. (It is worth noting, however, that, if the budgetary deficit continue at the current fraction of GDP, it would be multiplied by a large factor to finance the building of NPIs at public expense.)
The question of whether or not the energy budgets over the fifty year period, 2050 to 2100, can absorb the great energy costs unavoidably associated with such huge monetary flows can be answered in the same manner except that rp, r1, and rn are replaced by re, r2, and řn and Po is replaced by Po(E/GDP)max to get an upper bound on energy flows due to capital expenditures. These, of course, are the energy flows that are almost always neglected by flat-earth economists despite the fact that our government and the governments of other countries provide extensive tables of E/GDP. Clearly, someone else has been down this road ahead of me.
The reduction of r2 = 0.0248889787 by řn = 0.00033839 is so slight that I begin to suspect a mistake; however, since none can be found, I am forced to conclude that the energy costs of introducing the hydrogen economy would not require anything like an austerity program. The effect upon standards of living would not be felt – even by those who did not benefit directly from the expense. Of course, the possibility that proponents of nuclear have been overly optimistic in their assessment of the costs must be considered; however, even if they had exaggerated by a factor of two, the program cannot be judged infeasible for monetary or energy reasons. Other reasons must obtain.
Conclusions
The Ten-Point Plan Results in a Nuclear Society
During the first ten years of the Apollo Alliance program, Americans would enjoy an increase in the average standard of living, as measured by energy consumed per capita corrected for conservation (or, rather, the lack of it), of about 3.09% per annum. The most important conclusion for the Reference Case (CwC-ReferenceCase.xls) is that, with an increase in the standard of living ratio of 3.09 % per year for the remainder of the Twenty-First Century, the United States would need, by the year 2100, over 78,000 new nuclear power installations with an average capacity of 1000 megawatts electrical equivalence, although many would produce hydrogen rather than electricity to supplant carbon-based fossil fuels. To put this into perspective, New York City occupies 321 square miles exclusive of inland waterways of which 73% or 234 square miles is available for use. (http://hypertextbook.com/facts/2002/JordanLevine1.shtml) If a similar fraction of the total area of the Consolidated Greater New York Metropolitan Area, which includes parts of northern New Jersey, Long Island, etc. and which was home to 7.5% of the US population in the year 2000 (http://www.gwu.edu/~action/2004/convs/nyc04.html), were available for use, atomic power plants would occupy over 36% of the available space. Other users may have something to say about this. Of course, by 2100, nuclear power plants may require less area per megawatt, people may become less averse to having nuclear power plants in their own backyards, and rural people may have fewer objections to taking additional risks for the benefit of city people, or, much more likely, they may not be given the opportunity to object.
By the year 2100, the average rate of energy use per person would be an orgiastic 296 kilowatts. That’s 296 kilowatt-hours/hour or 21,623 kilowatt-hours/month measured as heat equivalents – approximately thirty times the current American lavish usage. Imagine the amount of motion, noise, and environmental destruction that would be generated by a person consuming energy at this rate. Certainly, under this scenario, “all boats would [or could] rise”; however, how many would ‘explode’ we cannot say. Although many people might wonder how their grandparents got along on less, misery and opulence would coexist in most households undoubtedly. But, most of this energy would not be degraded in residences nor by people consuming their personal energy budgets. Working people would be assisted by technologies unimaginably expensive to operate and to construct – not the least of which would be the nuclear power installations and their ancillary facilities and infrastructure. In 2005, a worker in the so-called information society has the equivalent of many slaves in the form of non-renewable resources to assist him; nevertheless, he works long hard hours. While it is true that, in 2100, he would have many more slaves in the form of nuclear energy to assist him, slave driving will continue to be hard work. The Apollo Alliance promised work, and the people would work – and work, and work, and work. Is the technology enslaved by the workers, or are the workers enslaved by the technology? But, this won’t happen. Such a rate of increase of energy consumption per person is unsupportable.
Four Additional Scenarios
The principal data for the year 2100 for the Reference Case (i) and four additional cases are given in Table 4 also the URLs for the spreadsheets. The additional cases are: (ii) the One-Percent Growth Case, (iii) the No-Growth Case, (iv) the No-Growth and No-Sales Case, and, finally, (v) the case of the Natural Economy, advocated by this author in a book (POS) and in in numerous essays hyperlinked to the website to which POS is linked written over the last ten or fifteen years. The computations for the ancillary cases do not have to be explained in detail as they are nearly the same as the computations for the Reference Case. I have used the numbers developed for the first thirteen years (2005 – 2018) of the Apollo Alliance project in all five scenarios.
|
Scenario |
GDP |
Econsumed |
tot. area |
NPI |
|
Reference Case |
326.864 |
3534.7 |
36831.4 |
78574 |
|
1% Growth |
326.864 |
598.7 |
5606.5 |
11961 |
|
No growth |
22.879 |
133.7 |
483.6 |
1032 |
|
No Growth & No Sales |
22.879 |
99.0 |
114.4 |
244 |
|
Natural Economy |
NA |
69.7 |
0 |
0 |
Table 4a. Principal results for five scenarios, Part 1
|
Scenario |
pop |
Estd.liv./Gcap |
URL |
|
Reference Case |
0.6331225 |
5582.9 |
|
|
1% Growth |
0.633122 |
945.7 |
|
|
No growth |
0.328541 |
407.1 |
|
|
No Growth & No Sales |
0.328541 |
407.1 |
|
|
Natural Economy |
0.146172 |
915.0 |
Table 4b. Principal results for five scenarios, Part 2
One-Percent Growth
The original spreadsheet was set up so that slight changes only permit the examination of as many cases as may interest the reader or reviewer. For example, to study the case of one percent growth in the standard of living ratio, one simply changes rn,hat to 0.018 = 0.01 + 0.008, where the additional 0.008 accounts for the rate of increase of population assumed by the DOE. (We have done nothing yet to stabilize or reduce population.) One then adjusts r2 for the years 2015 – 2018 by trial and error until the value of the energy consumed adjusted for conservation computed by summing the energy demand adjusted for conservation, imports, and exports agrees with the value computed by exponentiation with rn,hat. For the years subsequent to 2018, the value of r2 equals rn,hat minus re. (See CwC-OnePercentGrowth.xls.) The principal results for the year 2100 are in Table 4. Presumably, people who recoil at the thought of more than 78,000 new nuclear power installations will not be especially comforted by the assurance that by moderating economic growth only 12 thousand need be built. Perhaps the most important reason for carrying out this long and tedious computation has been to help such people understand what is on the other end of the spoon of economic growth with which they wish to feed themselves. (A bright young woman I once knew who subsequently became a pediatrician admitted that she had no idea what was on the other end of the wires that led to the electrical outlet in her bedroom!)
But, no matter how low we set the rate of economic growth, even if the population be stable, after some finite period of time, we shall require one 1000 MWe nuclear power installation for every square kilometer in the United States or, for that matter, for every square centimeter. It is a trivial exercise to prove this. Although the period of time may be extremely long if we set the rate of growth sufficiently low, it is certainly less than infinity. A growth rate that can be sustained until the sun burns out would be indistinguishable from no growth. On the other hand, a growth rate so large that it would burn out the Earth in any period of time one chooses, however brief, can be computed by an equally trivial exercise. But, you and I have better things to do. Nevertheless, please note that, even with no growth in the economy and no growth in the population, quite a few nuclear power installations would be needed by 2100 due to the exhaustion of other resources unless something more is done – as we shall see in the next section.
The No-Growth Scenario
Just as in the One-Percent Growth Scenario (above), no changes are made to the reference case until 2018, by which time the trade imports have been brought to zero by the proper choice of rd. From 2018 to 2025, the exports are brought to zero by altering r1, after which r1 is set to cancel rp so that no further growth in GDP occurs. By this time the reader understands that the amount of money in the economy is irrelevant in an economy independent of the rest of the world, if you like it, and isolated from the rest of the world, if you don’t. The population is stabilized at 328,541,308, presumably because immigration is prohibited or because, in a nation where no one who is not rich can become rich, immigration is no longer attractive. Although from time to time money may be won or stolen by poor people from people who are richer than themselves, the typical flow of money (and emergy) is expected to be from poorer toward richer, especially if no political changes are made to prevent this from happening or to equilibrate wealth by other means. Perhaps Kurt Vonnegut’s claim in Hocus Pocus is correct, namely, that immigrants flock to America principally because America does less than any other modern nation to protect the poor from the predatory rich.
In any case, the population is set constant at the 2018 figure as is the energy demand – in the case of the energy demand, by adjusting r2. The energy supply remains the same as in the Reference Case, except that the additional nuclear required to balance the energy budget due the loss of other resources is much less – but not zero. To eliminate the use of nuclear altogether, which may not be advisable even, much more radical measures will be necessary. The No-Growth Scenario without fundamental political change – such as equal shares in the national dividend and equal political power for all – amounts to a reversion to Feudalism for all practical purposes. This is not a stable situation. Moreover, a nation in which Capitalism is recognized as not just failed but impossible is poised ideally for a move to some sort of communism. The question is: What sort of communism?
The No-Growth and No-Sales Scenario
First, Americans must understand that all economic activity results in the flow of embodied energy (emergy) and/or primary energy (exergy); next they should be asking themselves which economic activities are truly useful and which are harmful. One of the principal absurdities of American life is the amount of effort (energy) that goes into convincing people that they need something that, if it were not for this effort, they would not have missed having, if, indeed, the idea of such a thing would have occurred to them – even. As the old joke goes, “To sell something you have to someone who needs it, that’s not business; to sell something you don’t have to someone who doesn’t need it, that’s business!” Perhaps, it might be argued that, without this sort of promotion, there would be no progress, to which we might as well reply, “All progress is the exchange of one set of nuisances for another.” If we take a look at Sheet 3 in CwC-NoGrowthNoSales.xls, we note that sales and marketing is the third largest category of employment behind office work and government work, which is principally office work too, probably. These data were reproduced from the Bureau of Labor Statistics website at http://stats.bls.gov/oes/home.htm.
A much more aggressive approach to harm reduction is described in Energy in a Natural Economy some of which will be repeated in the next section; however, for the No-Growth, No-Sales Scenario, we begin by furloughing everyone employed in sales and related fields. Naturally, such people, who may not be suited for useful endeavor, have to live, therefore they must be paid to do whatever they find interesting to do provided they do not consume the energy that they would have consumed as active participants in the commercial sector of our economy. To account for their personal activities, I have deducted nothing from the energy consumed by the residential sector as one can see by reading the self-explanatory table on Sheet 3 of CwC-NoGrowthNoSales.xls. For additional discussion of the new leisure class, please see the book (POS) and other essays available on the website to which POS is linked.
Some of these sales and sales-related people have earned the highest incomes among all working people in our society. They cannot be expected to live on less than what everyone else receives as his due whether he works or not. On the other hand, they should not expect to receive more. Clearly, then, the No-Growth and No-Sales Scenario is a case of some sort of socialism wherein the national dividend is divided equally among all people with certain adjustments to account for special needs or the lack of special needs as in the case of children. Many such circumstances are discussed at great length in my book (POS).
The economy will continue to be centrally planned, therefore most government workers, such as the much-maligned bureaucrats whose dedication and skill has made possible the accumulation of the data used in this report, will continue to be employed and the energy they expend will be reduced no more than by the pro rata shares corresponding to the furloughing of employees in the commercial and industrial sectors. However, all of the employees in the business and financial operations category can be furloughed, as we shall have no more need for private bankers, stock brokers, and other money movers. Many conventional economies have discovered that, when public policy or some cataclysmic economic event eliminates a large number of jobs suddenly, many other jobs become superfluous through a sort of domino effect. Thus, we are justified to assume that at least half of all managers, office workers, food service workers, and deliverers of personal care can be furloughed as a result of relief from the profit motive and elimination of the (lethal) necessity for the economy to expand. Moreover, with economic shrinkage further need for construction and extraction (mostly of oil) disappears. Since property is nine-tenths of the law, nine-tenths of the lawyers will not be needed; and, since, the poor no longer need to prey upon the rich at the margins of society, we shall not need the other tenth. Similarly, healthcare support workers are concerned principally with collecting money; and may henceforth devote themselves to whatever interests them. Clearly, working hours can be very much shortened in a world of highly-valued and, for all we know, very useful leisure.
Thus, in the No-Growth and No-Sales Scenario, energy demand can be reduced by at least 25%. The exact fraction by which energy demand is to multiplied in 2025, namely, 0.740166355, is attained by shrinking at the exponential rate of -0.042982902 over the seven-year period 2018 – 2025, where
![]()
To correct the energy consumed for conservation, then, the energy consumed is multiplied by the reciprocal of 0.740166355, namely, 1.35104763. The principal results for the year 2100 are shown in Table 4. The virtues of the Leisure Society will be pursued further in the section on the Natural Economy which follows. (Also, see On the Work Ethic or On a New Theory of Classes.)
Energy in a Natural Economy
Dematerialism: Unwinding Materialism
Only three of my essays that so much as mention Dematerialism or the Natural Economy have been published, and two of these were written under cover of national drug policy (The Case for Drug Legalization and Decontrol in the United States), in one case, and chemical engineering thermodynamics (Thermodynamics, Availability, and Emergy), in another. The third essay, On My Philosophy, was published by the Humanists of Houston. Also, see Social Problems and Solutions. At this time, I shall try to present the material in Energy in a Natural Economy in a somewhat more useful form in conjunction with the spreadsheet calculation summarized above in the bottom row of Table 4.
Admittedly, the definition of materialism employed in my writing is rather specialized. People find it difficult to grasp exactly what I mean by the term, which has driven me to write a somewhat longer and more technical definition than many people are prepared for. However, once this specialized definition has been established, it is possible to establish materialism as the key to Pandora’s Box. (See Chapter 9 of POS.) That is, the problems of society do not have a host of subtle causes; they have one cause. Dematerialism then is the process of removing or unwinding materialism from a society that is sick nearly to death from materialism’s many and varied symptoms, toxins, and side-effects. The short description (of dematerialism) is in the second part of Social Problems and Solutions; the long description is in Chapter 11 of the book On the Preservation of Species.
Population
According to the International Programs Center, U.S. Bureau of the Census, the total population of the World, projected to 1-2-05 at 10:13:45 GMT (1-2-05 at 5:13:45 AM EST) was 6,410,052,489. According to the U.S. Bureau of the Census, the resident population of the United States, projected to 1-2-2005 at 5:11:25 AM EST was 295,168,501. Earlier this year, I asked Peter D. Johnson of the US Census Bureau, International Programs Center, who was a co-author of the International Data Base program, in what year would the population of the United States be less than one-half of the current population if (miraculously) every woman agreed to have no more than one live birth during her lifetime, i.e., if the Total Fertility Rate (TFR) were reduced to one. He sent figures and data in Excel files. Four of the figures are reproduced in Johnson Charts. In an accompanying note, he wrote, “This shows the U.S. population dropping to half the 2005 population by about 2128 if the TFR drops to 1.0 immediately or by 2142 if the TFR drops to 1.0 by 2025. In contrast, the world population would be halved by 2079 if the TFR were immediately cut to 1.0 or by 2094 if the TFR dropped to 1.0 by 2025. The reason the U.S. takes longer is because of the assumed migration which offsets some of the losses due to the fertility declines.” Clearly, the US population has a lot of ‘momentum’. I wondered what would happen under somewhat more ideal boundary conditions. Using Johnson’s spreadsheet and his initial conditions, I produced the spreadsheet computation reproduced on Sheet 2 of CwC-NaturalEconomy.xls.
I assumed: (i) no migration, (ii) from now on everyone dies precisely on his or her 100th birthday, (iii) every woman has her only child in her fifteenth year, which accounts for all childbirth from now on, and (iv) precisely half the people are female (not 51%). I found the population reduced to just below one-half of today’s population of 295.733 million in 2089. The longevity and early childbirth conditions give an upper bound on the rationality condition of one live birth per woman and the humanitarian condition of zero infant mortality. After 20 years, the population reaches 319.216 million due to the low death rates initially; but, after 45 years, the population has diminished to 282.823 million as one child per female begins to be felt and the 95-99-year-old cohort approaches parity with younger cohorts. In 2089, the population has reached 146.172 million by which time women are encouraged to resume having normal families so that kids can have siblings. I have assumed a stable population by the end of the century with deficits made up by immigration if necessary.
In a non-materialistic world, women who do not wish to enjoy more than one pregnancy cannot be forced or cajoled into multiple pregnancies. Since materialism is truly the only thing preventing women from being free, especially free from economic constraints, women's liberation can be achieved only by dematerialism – no matter what else it's called. Other causes of excessive (genocidal) procreation are discussed in Chapter 9 of On the Preservation of Species and below. I do not question the desirability of as many people as possible enjoying life under conditions that, at the very least, do not preclude sustainable happiness for all of humanity. ‘Sustainable’ and ‘happiness’ have technical definitions. For the convenience of the reader, this section concludes with some thoughts on excessive procreation.
Five motives for excessive procreation are (i) narcissism, (ii) fear that not all will live, (iii) cheap labor to promote family wealth, (iv) hope for support in old age, and (v) to spread rapidly a racial plurality, a religion, ideology, culture, or general system of “family values”, often superstitions and myths, to which the violator of the Token Theorem is committed, dedicated, or enthralled – or at least wishes others to be committed, dedicated, or enthralled. Accidental pregnancies will be treated as though they were simply another form of inadvertent environmental destruction. Presumably, inadvertent pregnancies can be eliminated by a combination of education, indoctrination, and science all unfettered by superstition. When a beloved child dies the parent’s grief is not diminished by the survival of another child, therefore the motive for having more children to ensure against such a tragedy may be assumed to be narcissistic.
A good case can be made that multiple pregnancies in women can be traced to the traditional domination of women by men that gave rise to the Feminist Movement. This is precisely the sort of domination that would not have arisen in a non-materialistic world, however many people will claim that materialism follows from competition for desirable sex partners rather than the reverse. Even though women very recently began to play more prominent roles in the societies of ‘developed’ countries, this should not be construed as the triumph of Feminism in its earlier manifestations. It is easy to see that the roles played by dominant women nowadays are indicative of exactly the same trends toward materialism that (true) Feminism opposed. Likewise, many of the excess pregnancies, including accidental pregnancies, identified as environmental destruction and tyranny above, may still be laid at the feet of man’s traditional domination of women and, in turn, materialism. Although, in some cases, women themselves may be convinced of the advisability of multiple pregnancies, the incentive to so convince them against their best interests could not exist and be effective outside of a materialistic setting. This can be discussed on a case-by-case basis.
Employment
In the book On the Preservation of Species (POS) and in some of the essays hyperlinked to the same website as POS, I have made the assertion that the energy consumed by an American-type, Capitalist-style, quasi-market economy in simply dividing up the pie is wasted and is not affordable in the shadow of Peak Oil. Whereas, Capitalism enriches a small fraction of the population, it more or less impoverishes most of the rest of the population relative to the mean. Nevertheless, many people favor Capitalism – presumably because they keep hoping that they will be one of the lucky ones who become rich even though their chances of doing so are negligible. As the circumstances attendant upon Peak Oil obtrude upon such people, they will be hard pressed to retain their dearly held and stridently proclaimed beliefs in a failed system.
The poor in a rich imperialist country like the United States consume more real wealth than the poor in a Third World country, therefore their exploiters can keep them quiet with constant reminders as to how much better off they are than people elsewhere. They do consume much more than poor people elsewhere, however most of the excess wealth enjoyed by America’s poor is consumed in unpleasant lifestyles replete with long trips and frequent commutes in an uncomfortable and unsafe automobile that belches noxious fumes that endanger everyone, including rich drivers of expensive cars who chalk it up to the unavoidable cost of poverty. Incidentally, the lavish lifestyle of all Americans, even the poor, excites the righteous indignation of people, even rich people, in poor nations whose sole recourse is what journalists refer to as terrorism. Perhaps the War on Terror is not intended to address this problem, but rather to control tightly the portion of the population in the rich nation who might notice this deception and conceivably wish to attempt a remedy of their own.
The two most important aspects of employment, according to the conventional wisdom, are (i) the amount of effort put into it and (ii) the wages received. Thus, employment is viewed on the left and on the right as a useful adjunct to a good life. This has catastrophic effects for the environment. Clearly, the consumption of high-grade energy (especially fossil fuels) is directly proportional to employment: first, because of energy consumed on the job and, second, because of the increased consumption of employed persons (and their dependents) over what they might have consumed were they not employed. Moreover, energy consumption leads to greater environmental destruction due to feverish activity, waste products, population growth, and much more. (See Chapter 7.)
A much more useful view of employment is almost never taken, namely, that the two most important aspects of employment are (i) the cost to the environment and (ii) the usefulness to the world of the products, e.g., food, clothing, shelter, health care, central heating and cooling, a few simple luxuries to take the misery out of life, and, from our viewpoint, computers and communications. According to this view, the world would be much better off if people who produce nothing useful would quietly amuse themselves at whatever they enjoy doing most, with which it is the purpose of a good education to acquaint them. Most people would not object to this arrangement provided they received the same living and enjoyed the same status as everyone else. Certainly, they should not expect more. (See On the Work Ethic or On a New Theory of Classes.)
The purpose of this exercise is to determine roughly what percentage of the national energy budget of the US could be saved by switching (gradually, but persistently) to a non-coercive, non-hierarchical voluntarily-planned decentralized economy. If we can save the energy consumed by competition for wealth, we can meet the challenge of living in a post-Peak-Oil economy. Please remember I am thinking about a smaller, but much better tasting, pie for my children’s children and for yours.
Great savings were achieved in the No-Growth and No-Sales Scenario by eliminating the profit motive and permitting the economy to shrink while retaining central planning. In a Natural Economy, as described in my book (POS), we can do even better. In the commercial sector, only three categories of employment are retained insofar as accounting for the energy that that they spend doing their work is concerned, namely, (i) Architecture and Engineering; (ii) Life, Physical, and Social Science; and (iii) Healthcare Professionals and Technical Workers. Computers and Mathematics is omitted as the great preponderance of practitioners are aiding and abetting commerce and real mathematics is a recreational activity. Community and Social Services were needed only because of Capitalism. Arts, Design, Entertainment, Sports, and Media are not done to benefit society, but to benefit the practitioners. The fact that they benefit society incidentally is irrelevant; they may continue to do this while consuming appropriate portions of their personal energy budgets. (Clearly, I am against the Star System.) People can protect themselves, prepare their own food, and clean and maintain whatever they (and the helpless members of their own social links) use. In the industrial sector, in addition to Construction and Extraction, half of Production is furloughed as such manufactured items as are used for commerce will not be needed.
On Sheet 3 of CwC-NaturalEconomy.xls, I have accounted for savings of nearly 50% of the energy demand by 2025. In the earlier posting Energy in a Natural Economy, I justified the elimination of 75% of the energy demand. Therefore, the present result is conservative. The exact value of the fraction of energy demand retained is 0.521318195, which results in an exponential rate of decrease of -0.093056384, one-seventh of the natural log of 0.521318195.
In a world without sales, marketing, parasitic management, authoritarian propaganda, mass-market media, high-profile professional sports and their absurd, over-priced venues, and in a world without wasteful, cruel, and unnecessary war machines, and vast, authoritarian governments, many things that are manufactured and maintained nowadays will not be needed. (In the wake of materialism there will be no one to spy on, regulate, prosecute, punish, persecute, or tax.) Also, in a non-materialistic world there need be no business or recreational transportation nor anyone commuting to a useless, boring job. Just think of all the energy savings that can be effected in a world with no monetary system, no banks, no financial services of any kind, no money, debts, bonds, stocks, or liens. Finally, with the US using half as much energy or less, the infrastructure to provide energy can be reduced proportionately.
An energy budget in 2025 of 69.7 emquads or 2.34 TWyears/year would be greater than the current world average; but, less than our current consumption of five times the world average. The United States would be an example to be followed – as opposed to a predatory, imperialist, world adventurer. This would constitute a show of good faith such that we would be safe forever from terrorism. Moreover, we would be able to produce most of the 2.34 TW from renewable technologies and supply the rest with domestic gas for as long as it took to decentralize, de-urbanize, convert to small sustainable technologies, and progress further along the path to a safe, sustainable, natural society – in short, a family of brothers, sisters, mothers, fathers, and children living in harmony with Nature and with each other.
Houston, Texas
May 9, 2005
Revised May 11, 2005
Hyperlinked References
1. http://www.apolloalliance.org/
2. CwC.html
3. http://www.dematerialism.net/index.html#AncillaryEssays
4. POS.html
5. Energy%20in%20a%20Natural%20Economy.html
8. http://www.oilcrisis.com/bartlett/reflections.htm
9. http://www.endofsuburbia.com
10. http://web.gat.com/pubs-ext/MISCONF03/A24265.pdf
11. http://www.oilcrash.com/articles/h2_eco.htm
12. http://stats.bls.gov/oes/home.htm
13. http://www.nuclear.gov/reports/NuclIndustryStudy.pdf
14. http://web.mit.edu/nuclearpower/
15. http://www.american.edu/TED/water.htm
16. http://www.worldwater.org/table1.html
17. GlobalWater.htm
19. Pimentel.pdf
23. CwC-NoGrowth.xls